BNB Eyes $605 After Breaking Key Resistance: Can The Bulls Maintain Momentum?
BNB has demonstrated significant bullish momentum, with a positive candlestick crossing the 100-day Simple Moving Average (SMA) in the 4-hour timeframe. The previous market scenario reveals that the digital currency has...
Archive context
Older archive item. Useful for background and entity history, but not a fresh market-moving signal.

BNB has demonstrated significant bullish momentum, with a positive candlestick crossing the 100-day Simple Moving Average (SMA) in the 4-hour timeframe. The previous market scenario reveals that the digital currency has faced multiple rejections at the $572 level.
This persistent resistance has cleared a path for the bulls to take charge and drive the price higher aiming at the $605 resistance level. As market dynamics shift, the key question is whether BNB can continue its current upward trend and hit the new target of $605.
In this article, we will analyze the recent price movements of BNB using technical indicators to determine whether the price can sustain its momentum to reach $605 or decline back to $572.
Technical Analysis Indicates Potential Rise To $605Technical analysis reveals that the price of BNB has successfully crossed above the 100-day Simple Moving Average (SMA) on the 4-hour chart, indicating a potential bullish trend and increased buying momentum. This position indicates that BNB’s price could continue rising as long as it remains above the SMA.
On the 4-hour chart, the Relative Strength Index (RSI) signal line has successfully risen above 50% into the overbought zone, signaling a potential shift in momentum, which suggests that buying pressure is increasing and the asset might experience further upward movement towards the $605.6 level.
Meanwhile, on the daily chart of BNB, the price is attempting to break above the 100-day SMA. A successful cross above this key technical level could signal potential bullish momentum. If BNB maintains its position above the 100-day SMA, it might trigger a sustained uptrend and greater investor confidence.
Also, the RSI indicator is trading above 50%, further supporting the possibility of a bullish trend, indicating that buying pressure is currently stronger than selling pressure. BNB’s 1-day chart shows that a bullish engulfing candlestick has formed following the rejection at $572. This pattern demonstrates a potential trend reversal and could make the $605 target achievable.
Key Levels To Observe When BNB Reaches $605 ResistanceBNB is on a bullish trajectory, targeting the $605 resistance level. If the price of BNB breaks and closes above the $605 level, it may continue its rally toward the next resistance level at $635 and possibly other levels beyond.
Nonetheless, should the digital asset face rejection at $605 and fail to break above it, a potential downward move could follow, possibly retreating to $572. The $572 level could act as a key support zone, where the price may stabilize or consolidate. However, if $572 fails to hold, a deeper correction could occur to lower support ranges such as $553.3 and $500.
As of the time of writing, BNB’s price has risen by 2.09%, trading at approximately $585 in the past 24 hours. The cryptocurrency boasts a market capitalization exceeding $85 billion and a trading volume surpassing $1.8 billion, indicating an increase of 2.09% and 3.57% respectively over the same period.
Why this matters
This altcoin story adds another data point to the current market tape and is useful when read alongside nearby source coverage.
Original source
Read on NewsBTCRelated market context

Bitcoin (BTC) Price Prediction: Glassnode Signals Potential Price Floor Near $80K as Sellers Capitulate
Similar spikes in Bitcoin’s realized losses preceded local price bottoms in August and September, raising the possibility that the...

Bitcoin Price Forecast: $81,500 Leaves Weekly Close Needing a Big Push
Sunday’s (October 18) Bitcoin price forecast puts it near $ 81,600, with technical indicators sending mixed signals. Shorter-term...

ChatGPT AI Predicts Million-Dollar Bitcoin by 2027
ChatGPT AI predicts Bitcoin will hit $1M+, which isn’t a crazy call, since many analysts share the same view. What makes this pred...
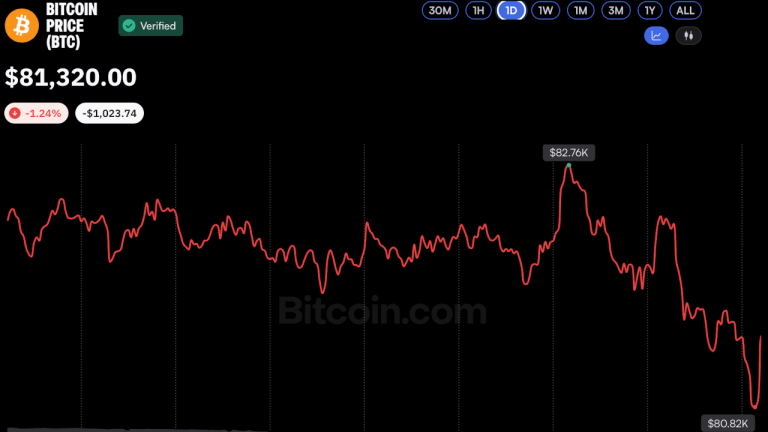
Bitcoin Price Hovers Near $81K as Analysts See Potential Market Bottom
Bitcoin slipped below $81,000 on Oct. 16 amid heightened market volatility, but analysts remained cautiously optimistic, suggestin...
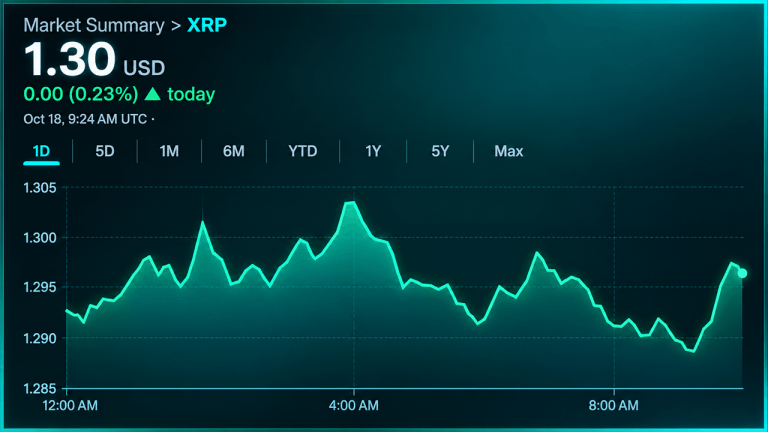
XRP Price Battles $1.30 as $2.77B Futures Market Loses Momentum
XRP’s price is fighting to hold $1.29 as its $2.77 billion futures market loses momentum and sellers maintain control. Technical i...

XRP Price Could Surge 145% as 2023 Rally Pattern Returns
XRP price traded near $1.34 on October 16, about 4% below the 200-day simple moving average (SMA) at $1.36. The immediate test is...