BNB Price Back on Track: Can It Break $535 to Move Higher?
BNB price is recovering higher from the $500 support zone. The price is now showing positive signs and might aim for more upsides above $535. BNB price started a recovery wave from the $500 support zone. The price is now...
Archive context
Older archive item. Useful for background and entity history, but not a fresh market-moving signal.

BNB price is recovering higher from the $500 support zone. The price is now showing positive signs and might aim for more upsides above $535.
- BNB price started a recovery wave from the $500 support zone.
- The price is now trading above $515 and the 100-hourly simple moving average.
- There is a key rising channel forming with resistance at $528 on the hourly chart of the BNB/USD pair (data source from Binance).
- The pair could gain bullish momentum if it clears the $535-$538 resistance zone.
After forming a base above the $500 level, BNB price started a decent upward move like Ethereum and Bitcoin. The price cleared the $510 and $515 resistance levels to move into a short-term bullish zone.
The price surpassed the 50% Fib retracement level of the downward move from the $5376 swing high to the $499 low. It even cleared the $520 resistance. The price is now trading above $515 and the 100-hourly simple moving average.
It is now consolidating near the 61% Fib retracement level of the downward move from the $5376 swing high to the $499 low. On the upside, the price could face resistance near the $528 level. There is also a key rising channel forming with resistance at $528 on the hourly chart of the BNB/USD pair.
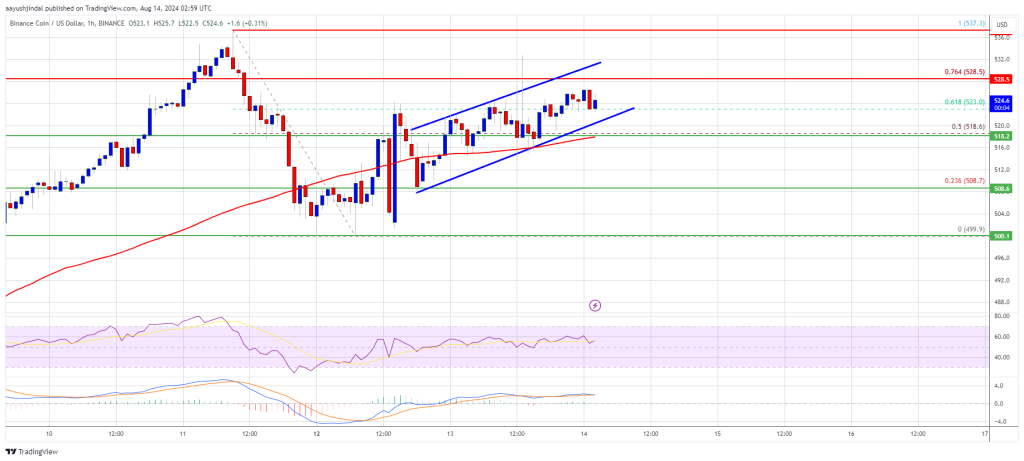
The next resistance sits near the $535 level. A clear move above the $535 zone could send the price higher. In the stated case, BNB price could test $550. A close above the $550 resistance might set the pace for a larger increase toward the $565 resistance. Any more gains might call for a test of the $580 level in the near term.
Another Decline?If BNB fails to clear the $535 resistance, it could start another decline. Initial support on the downside is near the $520 level. The next major support is near the $518 level.
The main support sits at $508. If there is a downside break below the $508 support, the price could drop toward the $500 support. Any more losses could initiate a larger decline toward the $480 level.
Technical Indicators
Hourly MACD – The MACD for BNB/USD is gaining pace in the bullish zone.
Hourly RSI (Relative Strength Index) – The RSI for BNB/USD is currently above the 50 level.
Major Support Levels – $518 and $508.
Major Resistance Levels – $528 and $535.
Why this matters
This altcoin story adds another data point to the current market tape and is useful when read alongside nearby source coverage.
Original source
Read on NewsBTCRelated market context

Bitcoin (BTC) Price Prediction: Glassnode Signals Potential Price Floor Near $80K as Sellers Capitulate
Similar spikes in Bitcoin’s realized losses preceded local price bottoms in August and September, raising the possibility that the...

XRP Price Could Surge 145% as 2023 Rally Pattern Returns
XRP price traded near $1.34 on October 16, about 4% below the 200-day simple moving average (SMA) at $1.36. The immediate test is...

Bitcoin Price Forecast: $81,500 Leaves Weekly Close Needing a Big Push
Sunday’s (October 18) Bitcoin price forecast puts it near $ 81,600, with technical indicators sending mixed signals. Shorter-term...

ChatGPT AI Predicts Million-Dollar Bitcoin by 2027
ChatGPT AI predicts Bitcoin will hit $1M+, which isn’t a crazy call, since many analysts share the same view. What makes this pred...

XRP Price Prediction: Can Ripple Stop the Bleeding?
XRP price prediction shows Ripple trading around $1.30 after a difficult week, with CoinGecko data showing a 7.2% decline over sev...

Cysic suspends bridge after attacker mints tokens and moves $727,000 to Ethereum
The attacker, after minting 10 million CYS, managed to bridge about $727,000 in proceeds to Ethereum through Mayan, deBridge and S...