BNB Resilience: Holding Firm At $560 – What’s Next?
The price of BNB hasn’t fallen below its previous low, and it’s showing some strong signs of heading up. After a spell of moving downward, the Binance Smart Chain’s native token is aiming for an upward bounce back toward...
Archive context
Older archive item. Useful for background and entity history, but not a fresh market-moving signal.

The price of BNB hasn’t fallen below its previous low, and it’s showing some strong signs of heading up. After a spell of moving downward, the Binance Smart Chain’s native token is aiming for an upward bounce back towards its earlier high.
Technical Indicators Point Toward Sustained Uptrend For BNBTo figure out where the BNB price might be headed next, several indicators can be used to examine the chart:
4-Hour MACD: A technical look at the MACD indicator from the 4-hour timeframe, the MACD histograms are trending above the zero line, and both the MACD line and the Signal line have crossed and are heading towards the MACD zero line, indicating a bullish trend. This can be seen in the above image.
RSI 4-hour Timeframe: The formation of the Relative Strength Index (RSI) in the below image also suggests an upward movement as the RSI signal line is seen trending above the 50% level. This indicates that buyers are still very active in the market therefore overpowering the strength of sellers.
4-hour alligator: A look at the alligator indicator from the 4-hour time frame shows that BNB is trading above the alligator lines as the alligator lip and teeth have both successfully crossed above the alligator jaw, suggesting that the price might be starting a new rally.
At the time of writing, the price of BNB was up by 1.35% and was trading around $561 in the last 24 hours. BNB price is showing bullish signs and also forming a base above the $508.1 support level. Also, the price is trading above the bearish trend line and below the 100 Simple Moving Average (SMA) on the 4-hour chart.
Final ThoughtsFrom the previous downward movement, the price of BNB has managed to create one major resistance level of $635 and one major support level of $508. Currently, BNB is moving toward this resistance level and if it breaks above this level, the price might go even further to create a new high.
On the other hand, if the price fails to break above this major resistance, it will reverse and start a downward movement toward its previous support and if it manages to break below this support level, the price might move further downward thereby starting a new downward trend.
Why this matters
This altcoin story adds another data point to the current market tape and is useful when read alongside nearby source coverage.
Original source
Read on NewsBTCRelated market context
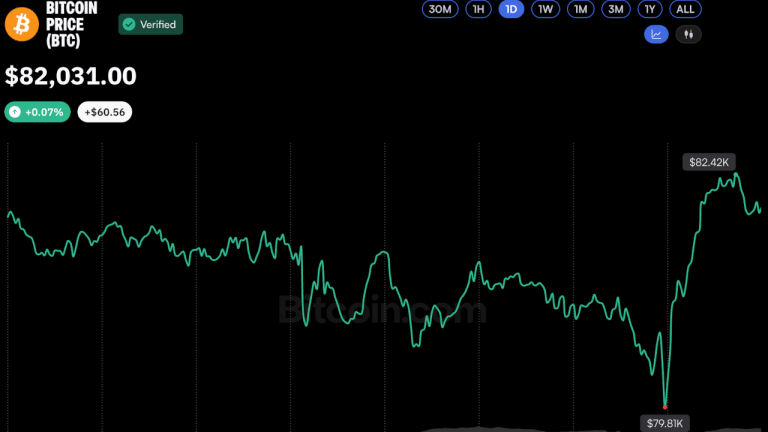
Bitcoin Price Rebounds Above $82K After Brief Dip Below $80K
Bitcoin staged a rapid recovery Thursday, climbing back above $82,000 to trade slightly higher over 24 hours with a market cap nea...

Bitcoin Price Prediction: Bitcoin Tracks Treasury Real Rates, Fidelity Finds
Bitcoin is trading at $82,000, rebounding from $80,000 since yesterday morning, as traders weigh a new macro signal that could fli...

Bitcoin Briefly Slides Below $80,000 On More Hot Inflation Data
Bitcoin Magazine Bitcoin Briefly Slides Below $80,000 On More Hot Inflation Data Bitcoin’s price momentarily dipped below $80,000...

XRP Price Could Surge 145% as 2023 Rally Pattern Returns
XRP price traded near $1.34 on October 16, about 4% below the 200-day simple moving average (SMA) at $1.36. The immediate test is...

Polymarket Bitcoin and Rate Hike Odds Shift as CME Says No Change
Polymarket put the odds of a 25-basis-point Federal Reserve rate hike in October at 23%, with $43 million traded, while CME FedWat...

Ethereum Price Prediction: ETH Outpaces the Market as Crypto Rebounds
Ethereum is outperforming the crypto market, rising by almost 3% over the past 24 hours to just a notch under $2,500 as digital as...