Cardano (ADA) Pulls Back, Will Bears Push It Lower Again?
Cardano price started a downside correction from the $1.020 zone. ADA is now showing some bearish signs and might decline toward $0.80. ADA price started a downside correction below the $0.920 support zone. The price is...
Archive context
Older archive item. Useful for background and entity history, but not a fresh market-moving signal.

Cardano price started a downside correction from the $1.020 zone. ADA is now showing some bearish signs and might decline toward $0.80.
- ADA price started a downside correction below the $0.920 support zone.
- The price is trading below $0.90 and the 100-hourly simple moving average.
- There is a key bearish trend line forming with resistance at $0.940 on the hourly chart of the ADA/USD pair (data source from Kraken).
- The pair could extend losses if it trades below the $0.80 region.
After a steady increase, Cardano faced sellers above the $1.00 level started a fresh decline, like Bitcoin and Ethereum. ADA traded below the $0.950 and $0.920 support levels.
There was a move below the $0.90 support. The bears pushed the price below the 50% Fib retracement level of the upward move from the $0.7650 swing low to the $1.020 high. There is also a key bearish trend line forming with resistance at $0.940 on the hourly chart of the ADA/USD pair.
Cardano price is now trading below $0.90 and the 100-hourly simple moving average. On the upside, the price might face resistance near the $0.880 zone.
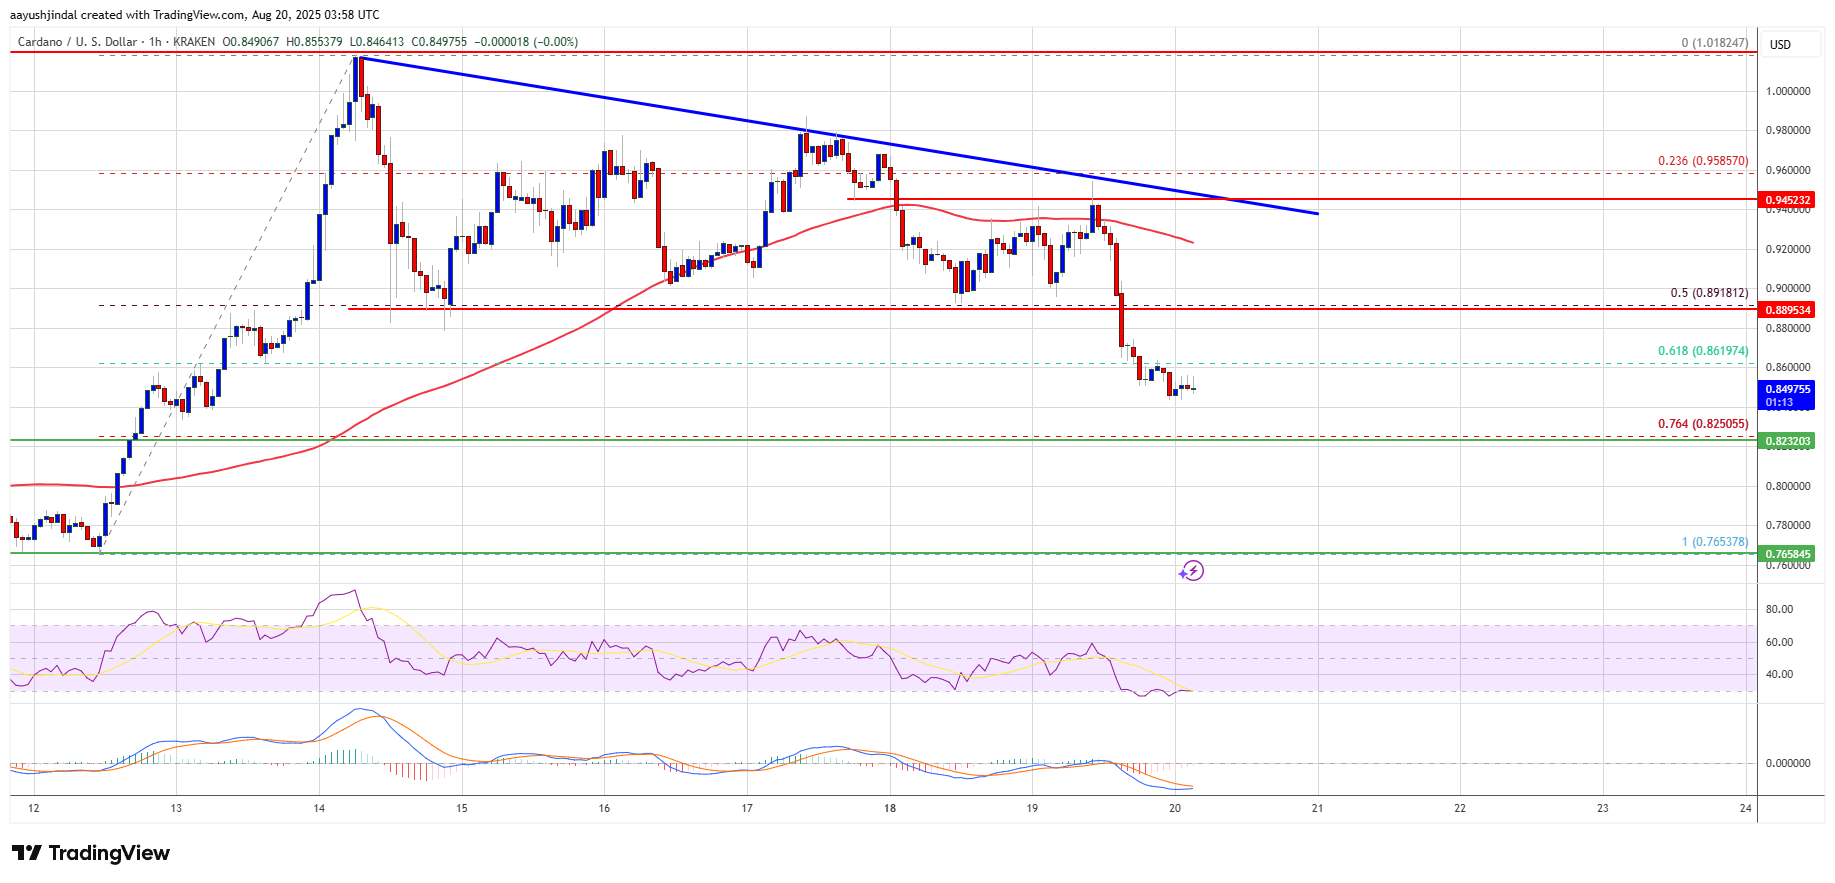
The first resistance is near $0.8920. The next key resistance might be $0.940. If there is a close above the $0.940 resistance and the trend line, the price could start a strong rally. In the stated case, the price could rise toward the $1.00 region. Any more gains might call for a move toward $1.050 in the near term.
More Losses In ADA?If Cardano’s price fails to climb above the $0.940 resistance level, it could start another decline. Immediate support on the downside is near the $0.840 level.
The next major support is near the $0.8250 level and the 76.4% Fib retracement level of the upward move from the $0.7650 swing low to the $1.020 high. A downside break below the $0.8250 level could open the doors for a test of $0.80. The next major support is near the $0.780 level where the bulls might emerge.
Technical Indicators
Hourly MACD – The MACD for ADA/USD is gaining momentum in the bearish zone.
Hourly RSI (Relative Strength Index) – The RSI for ADA/USD is now below the 50 level.
Major Support Levels – $0.8400 and $0.8250.
Major Resistance Levels – $0.9200 and $0.9400.
Why this matters
This altcoin story adds another data point to the current market tape and is useful when read alongside nearby source coverage.
Original source
Read on NewsBTCRelated market context

Hyperliquid (HYPE) Price Today: HYPE Holds $80 Support Despite Mounting Bearish Pressure
CoinGecko data puts Hyperliquid’s market capitalization at approximately $18.04 billion and its daily trading volume near $918 mil...

Ethereum Price Prediction: Hyperliquid Whale Opens $60M ETH Long
Ethereum traded at $2,500 as the price tests the $2,500 area after a volatile stretch with a slightly bearish prediction. But one...

Peter Schiff Surprised by Bitcoin’s Strength as Michael Saylor’s Strategy Boosts BTC Holdings to 848,250
Schiff continues to expect further declines, but Strategy’s latest purchases highlight the company’s commitment to Bitcoin as a lo...

XRP Price Prediction: Ripple Token Outperforms Tech Stocks as Asian Markets Turn Red
XRP price fell to $1.38, losing up 2.5% over 24 hours, while Asian risk assets were under pressure, and South Korea’s KOSPI fell m...

Bitway Crypto Hits All-Time High, Showing the Need for a Bitcoin-Compatible Chain
Bitway crypto has hit an all-time high as Bitcoin steadies near $83,500, mostly flat over 24 hours, but broader market conviction...
Tom Lee’s Bitmine Nears 5% of Ether Supply, Trims Weekly Buy to 12,532 ETH
Bitmine Immersion Technologies (NYSE: BMNR) held 6,028,946 ETH as of Oct. 11, the Ethereum treasury company said in a press releas...