Chainlink Pictured Chance Of A Further Pullback To This Level
Chainlink was bearish on its chart at the time of writing. Over the last week, the coin witnessed significant decline on its chart. Despite the 2% overnight appreciation the technical outlook of Chainlink remained negati...
Archive context
Older archive item. Useful for background and entity history, but not a fresh market-moving signal.

Chainlink was bearish on its chart at the time of writing. Over the last week, the coin witnessed significant decline on its chart. Despite the 2% overnight appreciation the technical outlook of Chainlink remained negative. Fall in the market movers prices has pushed many altcoins to travel south on their charts.
Prior to this, LINK was consolidating between $6.70 and $7.00 respectively. A fall in LINK’s price has caused it to travel below the $6.70 price mark. Technical outlook started to reflect a change in price direction as buying strength slightly grew in the market.
Despite the change on the technical outlook, LINK was still hovering in bearish territories. At the present moment, the altcoin’s price movement cannot be termed as an invalidation of the bearish thesis. For LINK to defeat the bears, the coin has to be above the $8.00 mark.
Along with that, buying strength has to consistently remain positive, a fall in that will drag the coin below the $6.00 support level. The global cryptocurrency market cap today is $1.03 Trillion with a 1.5% positive change in the last 24 hours.
Chainlink Price Analysis: Four Hour Chart Chainlink was priced at $6.58 on the four hour chart | Source: LINKUSD on TradingViewLINK was trading at $6.58 at the time of writing. Before the decline on its chart, the coin was priced between the $6.70 and $7.00 levels respectively.
Immediate resistance for the altcoin was at $6.70 which had previously acted as a support level.
If LINK can manage to swoop past the aforementioned level, the next price ceiling would be at $7.34.
Nearby support level for the coin was at $6.22 but if the bears take over completely, LINK might fall as low as $5.54.
The amount of Chainlink traded over the last trading session saw an increase which meant that buying strength was recovering in the market.
Technical Analysis Chainlink portrayed rise in buying pressure on the four hour chart | Source: LINKUSD on TradingViewThe altcoin over the last 24 hours rose by 2% and buying strength also displayed some recovery. The Relative Strength Index moved up and beyond the half-line which indicated that buying strength was slowly rising on the chart.
This rise in the buying strength cannot be termed as a bullish move as the coin has to move past the $6.70 price level.
Price of LINK however shot past the 20-SMA line which is an indication of buyers driving the price momentum in the market.
As the demand resurfaced, LINK moved above the 20-SMA line. For bulls to take over completely, the coin has to remain above the 20-SMA line.
Related Reading | Cardano Moves In The Red With The Market, Can The Price Of ADA Stay Above $0.46?
Chainlink displayed sell signal on the four hour chart | Source: LINKUSD on TradingViewThe altcoin despite rising on the chart minorly still displayed signs of being under bearish influence. The Moving Average Convergence Divergence portrays price momentum and reversals in the same.
MACD noted a bearish crossover and formed red signal bars.
These red signal bars were sell signal for the altcoin. Bollinger Bands which represents price volatility, had started to narrow down.
This reading meant that chance of price volatility and fluctuation was low at the time of writing.
Related Reading | BNB Basks In The Green As Price Glows 5.84% In Fields Of Red
Featured image from Libertex, chart from TradingView.comWhy this matters
This altcoin story adds another data point to the current market tape and is useful when read alongside nearby source coverage.
Original source
Read on NewsBTCRelated market context

Bitcoin Price Prediction: Can BTC USD Hold $82K Ahead of Next Week’s CPI Drop?
Bitcoin price prediction notes a brief recovery on Saturday, October 10, but the market remains poised for a weekly loss as rising...

Sam Altman ChatGPT AI Predicts Bitcoin to Hit Insane All-Time High in 2026
Sam Altman’s ChatGPT AI predicts Bitcoin could reach a new all-time high in 2026, nearly doubling its October 2025 high of $126,00...

Bitcoin’s weekend rebound faces an $80,400 test after nearly $730 million in ETF outflows
Bitcoin traded near $82,900 in PerpFinder’s Oct. 10, 09:36 UTC snapshot, with traders watching whether the weekend rebound brings...

One year after 10/10, Bitcoin and Ether liquidity is back while altcoins lag
The crypto market's bifurcation highlights Bitcoin and Ether's institutional appeal, while altcoins face volatility and limited gr...
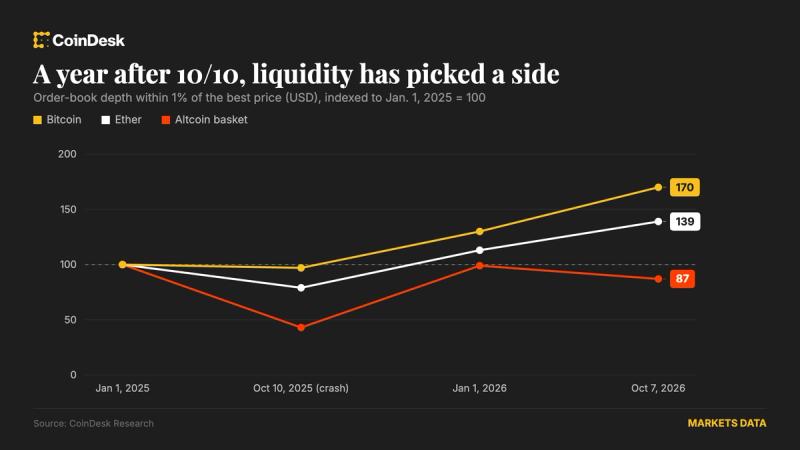
One year after 10/10, bitcoin and ether liquidity have rebuilt, but other altcoins still face risks
Bitcoin and ether order books are deeper than before the crash, while altcoin liquidity keeps eroding and spot trading remains wel...

XRP ETFs extend a 13-week inflow streak as Bitcoin, Ethereum and Solana funds shed $1.25 billion
US-listed XRP ETFs extended their inflow streak to 13 weeks as Bitcoin, Ethereum and Solana funds suffered nearly $1.25 billion in...