Chainlink Price Breaks Out of Wedge Pattern Eyes $41 in Continued Rally
The token recently surged past a key descending wedge structure, a pattern that has historically preceded strong rallies in previous cycles. With ChainLink price near $19.66 and holding steady gains, traders eye a break...
Archive context
Older archive item. Useful for background and entity history, but not a fresh market-moving signal.

The token recently surged past a key descending wedge structure, a pattern that has historically preceded strong rallies in previous cycles. With ChainLink price near $19.66 and holding steady gains, traders eye a break above $20 for further upside.
Analysts highlight the $13.5–$14.5 zone as a strong accumulation base, now transitioning into an expansion phase. As volume remains consistent and the daily RSI hovers above 73, Chainlink’s breakout structure suggests growing buyer conviction. The next key zones include $26 and potentially $41 if momentum holds.
Chainlink Price Breaks Out of Wedge Pattern, Eyes $41 in Continued RallyChainlink (LINK) is maintaining bullish momentum after confirming a breakout from a long-standing wedge pattern on the daily chart. Hence, the LINK price currently trades near $19.66, registering a 1.33% increase over the past 24 hours. Analysts are now assessing the breakout’s strength as LINK attempts to sustain this upward trend, with the $20 level emerging as the immediate resistance zone.
Source: BraveNewCoin
According to a chart analysis shared by @Crypt0minder, LINK’s recent breakout mimics historical cycles where descending wedge structures have led to strong upside moves. The latest breakout occurred after LINK held the $13.5–$14.5 accumulation support range, resulting in a sustained move toward the $19 zone. The green arrow on the chart signals an anticipated continuation toward $41, matching a long-term resistance level formed during previous cycle peaks.
Source:X
Daily Indicators Reflect Strength in Current RallyThe daily Relative Strength Index (RSI) currently stands above 73, confirming strong momentum on the upside. It has also remained well above its 50-day simple moving average, a condition typically associated with bullish continuation patterns. The alignment between rising Link price action and RSI strength supports the current uptrend structure.
Historical fractals in the chart show that similar breakouts from wedge formations in 2023 and 2024 led to rapid gains. These past structures featured multiple base formations and were followed by vertical rallies. The current price movement appears to follow this structure closely, positioning LINK for potential expansion if buyers retain control.
Short-Term Resistance Zones in Focus as Price ConsolidatesOn the 4-hour chart, analyst CW identified consolidation near $19.33 following a steady rally from below $14. LINK Price is currently hovering below the $20 psychological barrier. Support levels between $13.70 and $17.50 remain intact, offering reentry points for swing traders in the event of a price retracement.
Source:X
The next resistance zone is placed near $26, aligning with a historical sell wall. This level previously triggered pullbacks and remains a focus for traders watching for a continuation move. For the short term, traders are watching whether Chainlink price can break above $19.80 to test the $20 level with strength and volume support.
Volume and Price Action Maintain Uptrend ConditionsChainlink’s trading volume held steady at $866.12 million over the last 24 hours, reinforcing the recent move with consistent participation. Buyers have stepped in on each intraday dip, helping preserve the structure of higher lows. This trend has allowed the price to stabilize above previous resistance zones and build a potential base near $19.30.
The ChainLink price action over the past 24 hours includes a brief dip to $18.75 before recovering strongly and touching highs near $19.65. The reaction to these dips suggests that demand remains active. If ChainLink price can surpass $19.80, momentum may continue toward a short-term retest of $20 and eventually move closer to the $26 level if current buying conditions persist.
Why this matters
This altcoin story adds another data point to the current market tape and is useful when read alongside nearby source coverage.
Original source
Read on Brave New CoinRelated market context

Anthropic’s Claude AI Predicts a Wild Price for Chainlink (LINK)
Anthropic’s Claude AI predicts that in a peak bull-market setup, Chainlink (LINK) could hit $150–$250 by January 1, 2027, with a s...

SUI Crypto Up +2% Following $30M DATA Network Investment
SUI crypto trades at $1.12, up +2.2% over 24 hours, as traders weigh a sharp recent rebound against overhead resistance. The Sui F...
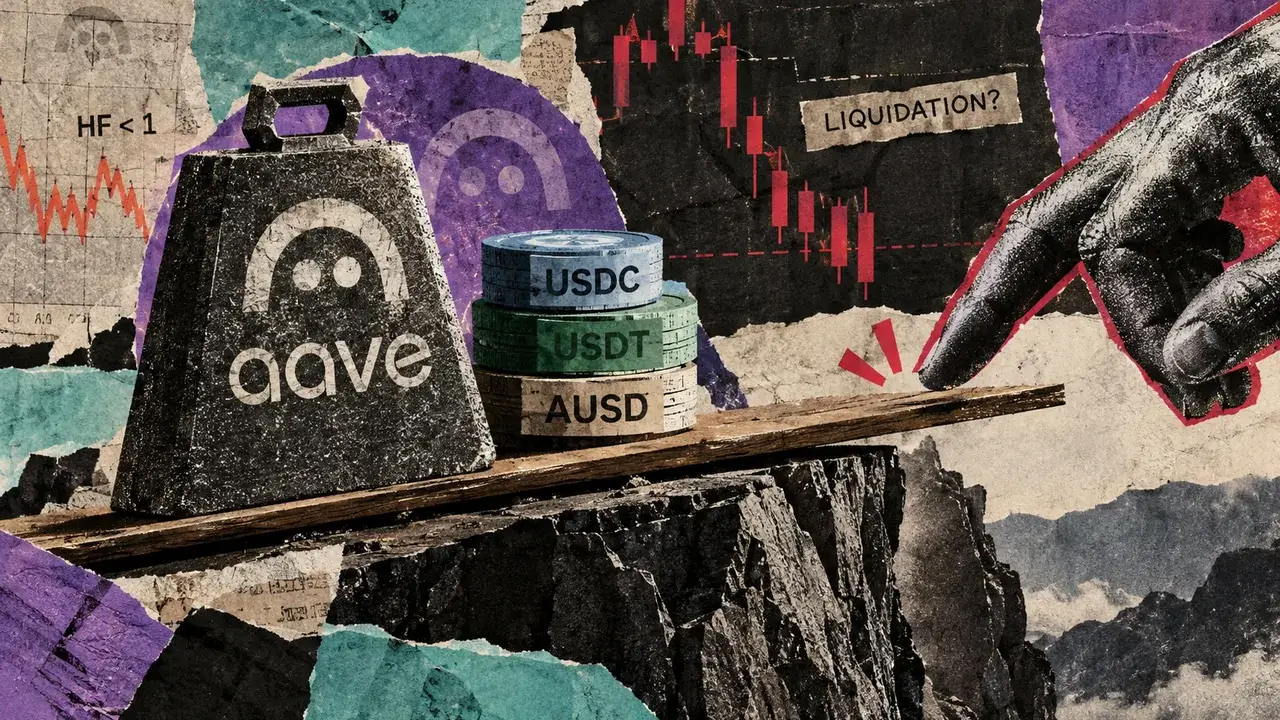
Some Aave loans sit near liquidation with collateral that can take hours to cash out
Some Aave loans backed by yield-bearing collateral had narrow liquidation buffers in LlamaRisk’s Oct. 9 snapshots. Every top PT-AU...

Meta AI Predicts This Huge Catalyst Could Lead to $40 XRP
Mark Zuckerberg’s Meta AI predicts an insanely wild bullish price target for XRP by January 1, 2027. The AI bot believes $25–$40 i...

Ripple’s RLUSD Gains Standard Chartered Custody on the XRP Ledger
Eligible institutions can now safeguard Ripple’s RLUSD on the XRP Ledger through Standard Chartered’s digital asset custody servic...

Meta AI Predicts 7-Figure BTC in 2026, But How?
Mark Zuckerberg’s Meta AI predicts that if a full-blown crypto bull market returns in Q4 and a landmark catalyst turbocharges it,...