Chainlink Price Prediction Signals Bearish Continuation as $17.50 Resistance Triggers Fresh Rejection
With LINK slipping back toward the $16 range, the market is once again testing structural support zones. At the time of writing, LINK is trading at $16.01 with a 24-hour loss of 0.71%, and momentum indicators reflect a c...
Archive context
Older archive item. Useful for background and entity history, but not a fresh market-moving signal.

With LINK slipping back toward the $16 range, the market is once again testing structural support zones. At the time of writing, LINK is trading at $16.01 with a 24-hour loss of 0.71%, and momentum indicators reflect a cautious stance.
Technical Setup Confirms Clean Rejection From $17.50The trading chart shared by trader Rai illustrated a well-executed short trade, with LINKUSDT.P moving exactly from the short entry zone of $17.50 to a take-profit target of $16.60. This move came after price failed to hold above the previous resistance structure and retraced sharply, validating the trade’s design.
The risk-reward setup placed the stop-loss just above the invalidation line at $17.66, while maintaining tight entry discipline. The setup was based on a visible rejection at the resistance zone, which quickly accelerated downside momentum.
Source: X
The structure revealed multiple lower highs, and bearish candles formed in succession once the resistance was retested. The red-shaded zone on the chart captured the stop-loss range while the green zone defined the target area.
Once the price broke below the interim support near $17.40, momentum carried it to the planned exit around $16.60. This movement reinforces the bearish continuation bias unless the token manages to form a new higher high or reclaim the $17.50 mark with strong volume.
Price Activity Suggests Weak Recovery AttemptChainlink’s 24-hour performance between August 2 and 3 showed both volatility and short-term recovery signs. The session began with a price dip from around $16.20 to $15.80, followed by a brief recovery above $15.95. However, the movement lacked sufficient volume to confirm a trend reversal. The price action displayed signs of support near $15.75, but the lack of follow-through prevented a decisive move.
Source: BraveNewCoin
Later in the day, LINK dropped again toward $15.60 before rebounding toward $16.01 by the end of the session. The daily trading volume reached $471.89 million, reflecting moderate activity. Market participants appeared to buy the dip, but without a surge in demand or positive structural changes, the bounce remained shallow.
The market cap stands at $10.85 billion with an available supply of 678 million LINK tokens. Buyers need to hold above $16.20 and reclaim prior resistance for a broader recovery phase to emerge.
At the Time of Writing, MACD Turns Cautiously BearishThe daily chart from TradingView indicates LINK is testing recovery momentum around the $16 mark. After reaching a local high near $20.28 in July, the asset declined and is now attempting to stabilize near previous breakout zones.
Price bounced by 2.36% in the most recent session, showing temporary strength at $16.00. However, resistance near $19.53 remains intact, and continued lower highs suggest a broader downtrend remains in play.
Source: TradingView
The MACD indicator reflects early signs of bearish momentum. The MACD line is at 0.27 while the signal line sits higher at 0.73, resulting in a histogram reading of -0.47. This crossover suggests weakening bullish pressure.
RSI has also fallen to 44.32, confirming reduced upward momentum. Without confirmation of a reversal—such as price holding above $17.20 or MACD flipping positive—Chainlink may continue to range or trend lower in the near term.
Why this matters
This altcoin story adds another data point to the current market tape and is useful when read alongside nearby source coverage.
Original source
Read on Brave New CoinRelated market context

Anthropic’s Claude AI Predicts a Wild Price for Chainlink (LINK)
Anthropic’s Claude AI predicts that in a peak bull-market setup, Chainlink (LINK) could hit $150–$250 by January 1, 2027, with a s...

Bitcoin’s rebound approaches the $85,000 zone where past buyers may sell
Bitcoin and Ethereum extended their weekend recovery, although on-chain indicators and derivatives positioning suggest the rebound...
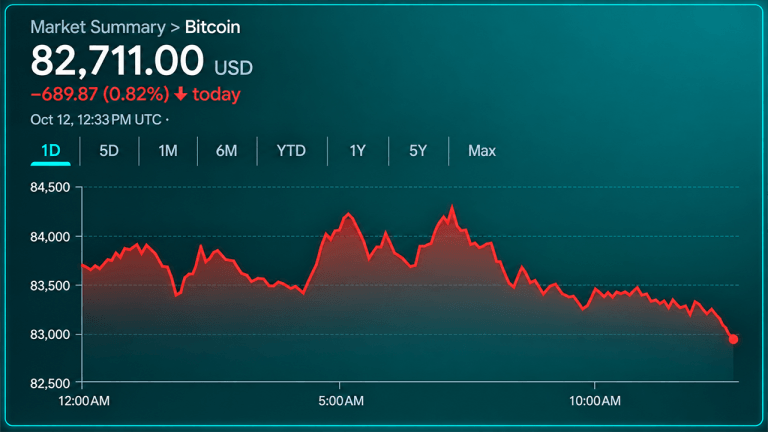
Bitcoin Price Walks a Tightrope as Bears Circle the $82K Zone
Bitcoin’s price hovered around $82,550 to $83,000 on Monday, Oct. 12, 2026, as technical indicators painted a largely neutral pict...
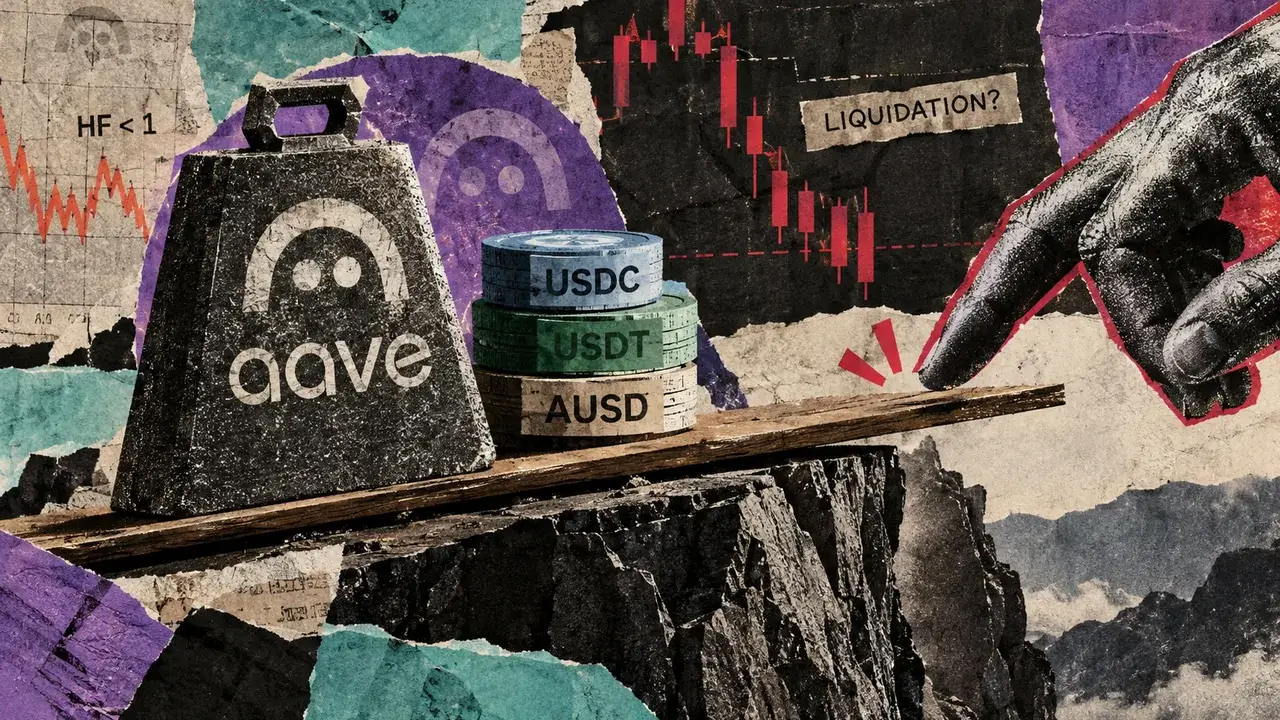
Some Aave loans sit near liquidation with collateral that can take hours to cash out
Some Aave loans backed by yield-bearing collateral had narrow liquidation buffers in LlamaRisk’s Oct. 9 snapshots. Every top PT-AU...

XRP Price Prediction: Can Ripple Hold $1.40 or is $1.20 Next?
Today’s XRP price prediction centers on Ripple’s expansion into Wall Street financing, reigniting a familiar concern for XRP holde...

Meta AI Predicts 7-Figure BTC in 2026, But How?
Mark Zuckerberg’s Meta AI predicts that if a full-blown crypto bull market returns in Q4 and a landmark catalyst turbocharges it,...