Dogecoin At Make-Or-Break Point After Multi-Year Trendline Test
Dogecoin (DOGE) closed last week on a bullish note after testing critical technical levels that could define its next directional move. The weekly chart on Binance (DOGE/USDT) reveals that DOGE is currently trading just...
Archive context
Older archive item. Useful for background and entity history, but not a fresh market-moving signal.

Dogecoin (DOGE) closed last week on a bullish note after testing critical technical levels that could define its next directional move. The weekly chart on Binance (DOGE/USDT) reveals that DOGE is currently trading just above the significant 0.786 Fibonacci retracement level at $0.167. This retracement is drawn from the all-time low at $0.0805 to the peak of $0.4844.
Dogecoin Reversal Confirmed?A notable technical development is the interaction with a long-standing descending trendline, extending from the May 2021 all-time high. DOGE recently retested this trendline as support after breaking above it in November 2024.
Last week’s candle printed a Hammer-like formation, characterized by a small real body near the top of the range and a significantly longer lower shadow. While the candle also displays a modest upper wick, the dominance of the lower shadow signals that buyers absorbed aggressive sell pressure below the trendline and pushed the price back above the 0.786 Fibonacci level – a strong bullish signal.
However, this week could be as important as last week. A weekly close above $0.167 seems essential to confirm the momentum. Otherwise, another test of the multi-year trendline could become a make-or-break moment for the Dogecoin price.
Notably, momentum indicators remain neutral to bearish. The weekly Relative Strength Index (RSI) closed around 39, reflecting subdued buying strength and highlighting that DOGE is still operating below the neutral 50 mark.
The Exponential Moving Averages (EMAs) are providing layered resistance above the current price. The 100-week EMA lies at $0.17284, positioned just above DOGE’s current range, while the 50-week EMA is located at $0.21427. The 20-week EMA, the more immediate resistance during previous rallies, now sits at $0.24805. Support is reinforced at the 200-week EMA around $0.13621, a level that would likely serve as a last line of defense should DOGE crash below the multi-year trendline.
Price action in recent weeks also shows DOGE breaking down from a bearish flag or channel formation, with the breakdown accelerating toward the confluence of the 0.786 Fibonacci level and the descending trendline retest. Despite this, the market responded with strong buying interest in the highlighted red support zone.
On-chain data further contextualizes the recent price action. Analytics firm Santiment reported via X today that Dogecoin, like most meme coins, has been heavily impacted during the ongoing two-month market-wide retracement. However, Santiment pointed out a bullish divergence on the network side.
The firm states: “Dogecoin, like most meme coins, have been hammered during the 2-month crypto-wide retrace. However, we recommend keeping an eye on the rising level of wallets holding at least 1M $DOGE, which has recovered during the price dump. Active addresses are also at 4-month highs.”
Adding to this sentiment, crypto analyst Daan Crypto Trades commented via X: “DOGE similar to PEPE but has already retaken the Election level after sweeping it. I think these are key levels to keep watching on a lot of these alts. A sweep & retake signals some short term relief and these levels can offer a clean invalidation level afterwards.”
This aligns with the technical observation that DOGE’s recent price action may represent a sweep of liquidity below a key level, followed by a recovery above support — a typical short-term bullish reversal pattern in crypto markets.
Why this matters
This altcoin story adds another data point to the current market tape and is useful when read alongside nearby source coverage.
Original source
Read on NewsBTCRelated market context

XRP Price Prediction: XRP Duo Turn Bullish, $1,000 Dream Lives On
XRP is trading at $1.34, up more than 1% after a brutal Wednesday. Ripple CEO Brad Garlinghouse says XRP has legal clarity despite...
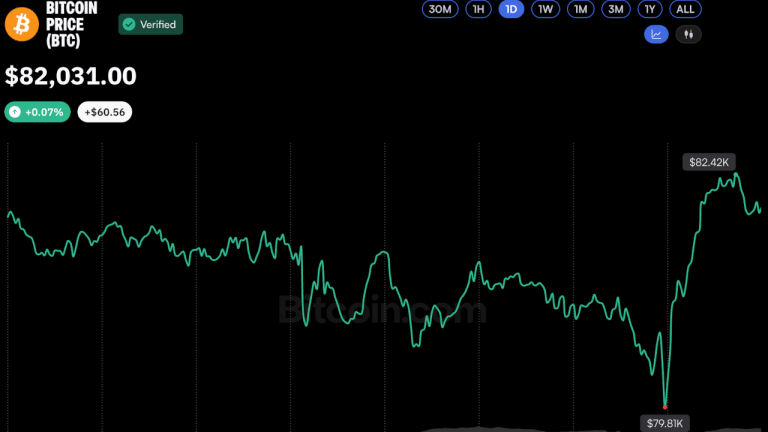
Bitcoin Price Rebounds Above $82K After Brief Dip Below $80K
Bitcoin staged a rapid recovery Thursday, climbing back above $82,000 to trade slightly higher over 24 hours with a market cap nea...

Google Gemini AI Predicts Bitcoin to Hit $175K by 2027
When prompted, Google Gemini AI predicts that by January 1, 2027, Bitcoin could be trading for $175,000. It gives a hypothetical c...

Ethereum Price Prediction: ETH Outpaces the Market as Crypto Rebounds
Ethereum is outperforming the crypto market, rising by almost 3% over the past 24 hours to just a notch under $2,500 as digital as...

Bitcoin Briefly Slides Below $80,000 On More Hot Inflation Data
Bitcoin Magazine Bitcoin Briefly Slides Below $80,000 On More Hot Inflation Data Bitcoin’s price momentarily dipped below $80,000...

XRP Price Could Surge 145% as 2023 Rally Pattern Returns
XRP price traded near $1.34 on October 16, about 4% below the 200-day simple moving average (SMA) at $1.36. The immediate test is...