Dogecoin Crash? Analyst Predicts Drop To $0.12 Before Rebound
A recently published Dogecoin (DOGE) chart by analyst Paul (@Zig_ZagTrades) suggests that the popular meme-based cryptocurrency could slide as low as $0.12 in a final corrective phase before attempting a significant rebo...
Archive context
Older archive item. Useful for background and entity history, but not a fresh market-moving signal.

A recently published Dogecoin (DOGE) chart by analyst Paul (@Zig_ZagTrades) suggests that the popular meme-based cryptocurrency could slide as low as $0.12 in a final corrective phase before attempting a significant rebound. The 1-day chart, shared on X, outlines a textbook Elliott Wave structure that Paul interprets as a larger (A)–(B)–(C) correction, culminating in a potential Wave 2 near the $0.12–$0.15 region.
More Downside For Dogecoin Ahead?In Paul’s analysis, Dogecoin has been tracing a five-subwave decline since reaching a prominent peak labeled as Wave 1 on his chart. This top coincided with a multi-day surge that lost momentum and reversed lower, leading to a series of smaller waves marked as 1, 2, 3, 4, and now 5. The analyst indicates that this fifth and final subwave is likely concluding a broader C wave (or 2nd wave if counting at a higher degree). Paul’s notations highlight a “GZ” (a “Golden Zone” commonly used by traders to pinpoint Fibonacci support clusters), and his markings pinpoint Fibonacci ratios that could define DOGE’s near-term floor.
The chart shows a cluster of key retracement levels spanning from $0.16 down to the mid-$0.11 range. Paul highlights Fibonacci levels at 61.8% around $0.160257 and $0.150508, alongside deeper retracements at 78.6% near $0.118726 and a 100% projection around $0.126709. These numeric zones appear to bracket the “GZ” in which Paul believes DOGE may complete its final subwave. According to the chart, the $0.12–$0.15 pocket stands out as the most critical price territory for bulls seeking to halt the ongoing downtrend.
The path from the current price region toward this lower objective is labeled with a subwave count that suggests a final push beneath prior lows. Candlestick patterns on the chart confirm a sequence of lower highs and lower lows in recent weeks, a sign that the bearish momentum remains intact. Volume bars at the bottom indicate steady selling pressure accompanying downward impulses, in line with the view that DOGE could still be carving out its terminal leg of the correction.
Paul’s use of Ichimoku Cloud settings shows that the price has consistently traded below the cloud since late January, indicating that DOGE has yet to reestablish any bullish momentum. The shaded green cloud area on his chart appears to have acted as dynamic resistance, backing up the notion that the market has remained in a corrective posture for several weeks. The analyst’s labeling of the waves beyond the purported bottom, marked as (1) to (5), suggests an expectation of an eventual upward cycle if and when the coin finds support in the “GZ” zone.
While the chart projects a subsequent rally from the anticipated low, no guarantees exist that DOGE will definitely hold the $0.12–$0.15 band. Failure to do so would theoretically extend the corrective pattern and undermine the bullish wave count, but Paul’s annotation implies that he sees the current downswing as a last flush of sellers. In his own words, “DOGE 1D: A Subwave 5 drop setting up a wave C/2 finish in the GZ for DOGE,” suggests an expectation of a local bottom in this area, although the market’s overall direction will hinge on whether enough buyers step in at those Fibonacci levels.
At press time, DOGE traded at $0.17
Why this matters
This altcoin story adds another data point to the current market tape and is useful when read alongside nearby source coverage.
Original source
Read on NewsBTCRelated market context
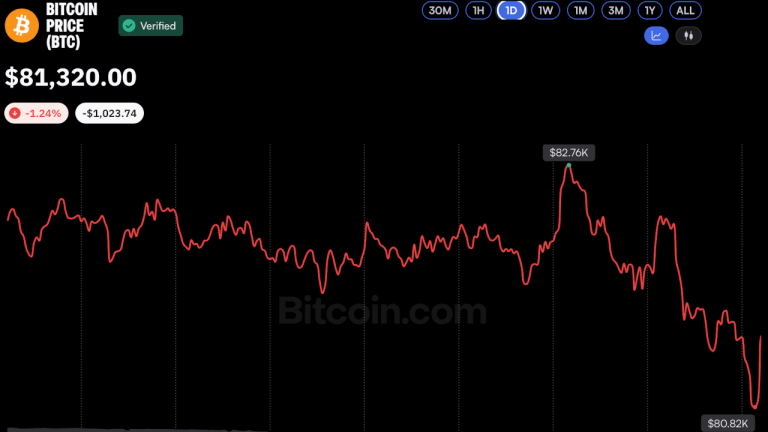
Bitcoin Price Hovers Near $81K as Analysts See Potential Market Bottom
Bitcoin slipped below $81,000 on Oct. 16 amid heightened market volatility, but analysts remained cautiously optimistic, suggestin...

Crypto Analyst Lark Davis: The Bitcoin Bull Run has Begun
Bitcoin Magazine Crypto Analyst Lark Davis: The Bitcoin Bull Run has Begun Bitcoin has been trading sideways in the $80Ks, but Lar...

MSCI finalizes index rules that put Strategy, crypto treasury firms at risk of exclusion
MSCI's new non-operating company rules could exclude Strategy, Metaplanet and SharpLink. The final list of affected firms is due N...

Why Is XRP Down Today? Bears Target $1.30 Support as Selling Pressure Builds
The downturn has weakened XRP’s short-term technical structure, leaving traders focused on whether buyers can defend nearby suppor...
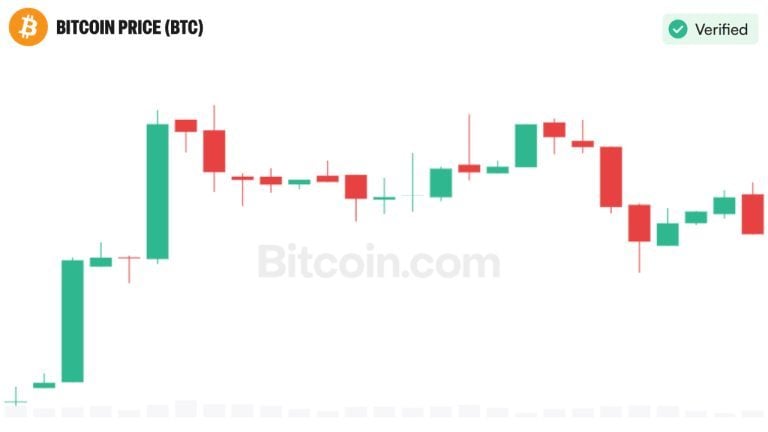
Analyst Sees Bitcoin Beyond $175K as Market Structure Shifts
Institutional ownership and changes in crypto financing may reduce bitcoin’s vulnerability to severe downturns, Siebert Financial...
Standard Chartered Brings Bitcoin Trading and Custody to Affluent UAE Clients
On Wednesday, the banking giant managing nearly $1 trillion in assets, Standard Chartered, revealed it is making new moves inroads...