Dogecoin (DOGE) Pulls Back — Is A Bounce from $0.1650 Support on the Horizon?
Dogecoin started a fresh increase above the $0.1700 zone against the US Dollar. DOGE is now correcting gains and might find bids near the $0.1650 zone. DOGE price started a decent upward move above the $0.1700 level. The...
Archive context
Older archive item. Useful for background and entity history, but not a fresh market-moving signal.

Dogecoin started a fresh increase above the $0.1700 zone against the US Dollar. DOGE is now correcting gains and might find bids near the $0.1650 zone.
- DOGE price started a decent upward move above the $0.1700 level.
- The price is trading above the $0.1650 level and the 100-hourly simple moving average.
- There was a break below a key bullish trend line with support at $0.1760 on the hourly chart of the DOGE/USD pair (data source from Kraken).
- The price could start a fresh increase if it clears the $0.1800 resistance zone.
Dogecoin price started a fresh increase above the $0.1650 resistance, like Bitcoin and Ethereum. DOGE climbed above the $0.1700 and $0.1800 resistance levels before the bears appeared.
A high was formed at $0.1852 and the price started a downside correction. There was a move below the $0.180 and $0.1750 levels. The price dipped below the 23.6% Fib retracement level of the upward move from the $0.1558 swing low to the $0.1852 high.
There was also a break below a key bullish trend line with support at $0.1760 on the hourly chart of the DOGE/USD pair. Dogecoin price is now trading above the $0.170 level and the 100-hourly simple moving average.

Immediate resistance on the upside is near the $0.1780 level. The first major resistance for the bulls could be near the $0.180 level. The next major resistance is near the $0.1850 level. A close above the $0.1850 resistance might send the price toward the $0.1920 resistance. Any more gains might send the price toward the $0.1980 level. The next major stop for the bulls might be $0.200.
Another Decline In DOGE?If DOGE’s price fails to climb above the $0.180 level, it could start another decline. Initial support on the downside is near the $0.1720 level. The next major support is near the $0.1705 level and the 50% Fib retracement level of the upward move from the $0.1558 swing low to the $0.1852 high.
The main support sits at $0.1650. If there is a downside break below the $0.1650 support, the price could decline further. In the stated case, the price might decline toward the $0.1550 level or even $0.1450 in the near term.
Technical Indicators
Hourly MACD – The MACD for DOGE/USD is now losing momentum in the bullish zone.
Hourly RSI (Relative Strength Index) – The RSI for DOGE/USD is now below the 50 level.
Major Support Levels – $0.1705 and $0.1650.
Major Resistance Levels – $0.1800 and $0.1850.
Why this matters
This altcoin story adds another data point to the current market tape and is useful when read alongside nearby source coverage.
Original source
Read on NewsBTCRelated market context

Why Is XRP Down Today? Bears Target $1.30 Support as Selling Pressure Builds
The downturn has weakened XRP’s short-term technical structure, leaving traders focused on whether buyers can defend nearby suppor...
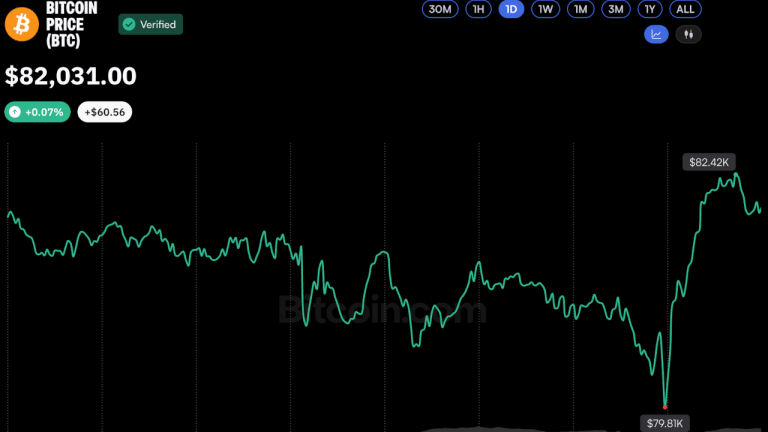
Bitcoin Price Rebounds Above $82K After Brief Dip Below $80K
Bitcoin staged a rapid recovery Thursday, climbing back above $82,000 to trade slightly higher over 24 hours with a market cap nea...

Ethereum Price Prediction: ETH Outpaces the Market as Crypto Rebounds
Ethereum is outperforming the crypto market, rising by almost 3% over the past 24 hours to just a notch under $2,500 as digital as...

Claude AI Predicts that Chainlink (LINK) Could Hit Triple Digits in 2026
Claude AI predicts a wildly bullish price target for Chainlink (LINK), claiming it could reach $100 by January 1, 2027, if a near-...

XRP Price Prediction: Evernorth’s $648M Game Plan Takes Shape
XRP trades at $1.30, down 6% over 24 hours, as traders weigh sticky U.S. inflation against a major institutional treasury plan. Ev...

XRP Price Could Surge 145% as 2023 Rally Pattern Returns
XRP price traded near $1.34 on October 16, about 4% below the 200-day simple moving average (SMA) at $1.36. The immediate test is...