Dogecoin Price Continues To Consolidate But A Move Above This Level Could Fuel A Rally
Dogecoin price has continued to consolidate. However, the coin showed signs of recovery on its one-day chart. Over the last 24 hours, the coin hasn’t made much progress. In the past week, Dogecoin price just moved up by...
Archive context
Older archive item. Useful for background and entity history, but not a fresh market-moving signal.

Dogecoin price has continued to consolidate. However, the coin showed signs of recovery on its one-day chart. Over the last 24 hours, the coin hasn’t made much progress.
In the past week, Dogecoin price just moved up by 0.4%, which indicates that the coin is still in a consolidated price range.
The technical outlook for Dogecoin indicated that buyers were not in control of the market at press time. This meant that Dogecoin price was still experiencing bearish pressure.
For Dogecoin to be able to regain the bulls back, it is important that the meme-coin breaks past its immediate price ceiling.
Demand for Dogecoin continued to remain low, which is why the bears could at any point invalidate the brief recovery that the coin made.
If DOGE continues to consolidate over the next trading sessions, the coin could fall to its local support level.
For a rally to happen, the coin has to topple over the $0.07 price ceiling. Only then can the coin attempt to touch the $0.09 price mark.
Dogecoin Price Analysis: One-Day Chart Dogecoin was priced at $0.05 on the one-day chart | Source: DOGEUSD on TradingViewDOGE was trading for $0.05 at the time of writing. The coin is still trading laterally. Although it tried to climb on its chart, the buyers did not cooperate.
Overhead resistance for the coin stood at $0.06. A break above that can help Dogecoin touch the $0.07 price mark.
A move above the $0.07 mark would help the coin rally to $0.09. On the other hand, support for the coin stood at $0.47.
If buyers don’t return to the market, Dogecoin could also fall from its local support to the $0.03 price zone. In the last trading session, the amount of DOGE traded fell, which meant that the coin was under selling pressure.
Technical Analysis Dogecoin registered downtick in buying strength on the one day chart | Source: DOGEUSD on TradingViewThe crypto was making a recovery in terms of buying strength too. A slight demand would bring the buyers back. This was, however, not the case, as at press time, DOGE logged a fall in buying pressure.
The Relative Strength Index was below the zero-line, and that meant fewer buyers compared to sellers.
The Dogecoin price was also below the 20-SMA line. This corresponded with low demand for the meme-coin and it also meant that sellers were driving the price momentum in the market.
Dogecoin displayed sell signal on the one day chart | Source: DOGEUSD on TradingViewOther technical indicators also showed that the bears were in control of the asset. The one-day chart also showed a sell signal for the asset.
The Moving Average Convergence Divergence indicates the price momentum and direction of the crypto. MACD underwent a bearish crossover and also formed red histograms.
The onset of these red histograms were sell signal for Dogecoin. The Directional Movement Index determines the overall price direction and strength of the same.
DMI was negative as the -DI was above the +DI line. The Average Directional Index (red) fell below 20, which signalled that the current price direction is losing strength.
Featured image from UnSplash, Chart: TradingView.comWhy this matters
This altcoin story adds another data point to the current market tape and is useful when read alongside nearby source coverage.
Original source
Read on NewsBTCRelated market context

Bitcoin hedge funds face a liquidation trap when their collateral is split across markets
Here's a hypothetical situation: a hedge fund is making money, but one of its exchanges is about to liquidate its position anyway....

Bitcoin Price Prediction: Can BTC USD Hold $82K Ahead of Next Week’s CPI Drop?
Bitcoin price prediction notes a brief recovery on Saturday, October 10, but the market remains poised for a weekly loss as rising...

XRP ETFs extend a 13-week inflow streak as Bitcoin, Ethereum and Solana funds shed $1.25 billion
US-listed XRP ETFs extended their inflow streak to 13 weeks as Bitcoin, Ethereum and Solana funds suffered nearly $1.25 billion in...
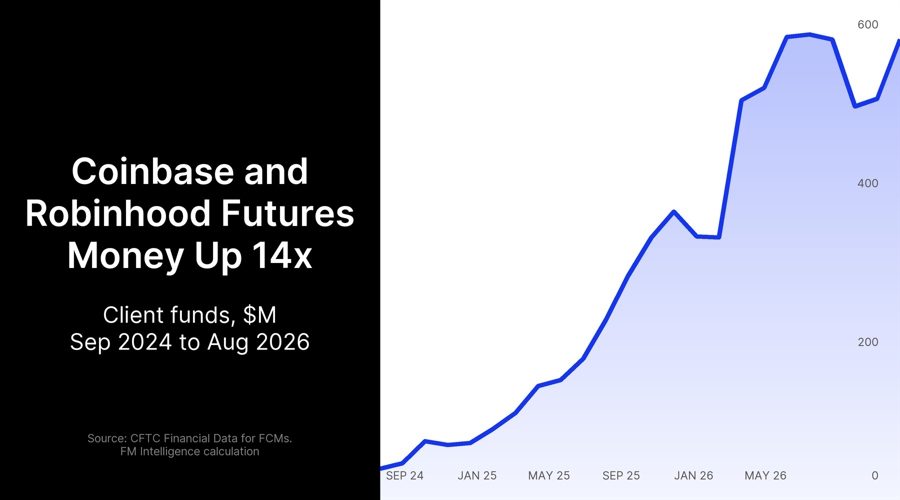
Coinbase and Robinhood Futures Arms Now Hold More Client Money Than the US Retail Forex Pool
The futures brokers of Coinbase and Robinhood held $581.4 million of segregated client money at the end of August. That is more th...

Sam Altman ChatGPT AI Predicts Bitcoin to Hit Insane All-Time High in 2026
Sam Altman’s ChatGPT AI predicts Bitcoin could reach a new all-time high in 2026, nearly doubling its October 2025 high of $126,00...

Being right about Bitcoin won’t save your 3x leveraged ETF position
Bitcoin's next recovery could vindicate your investment thesis but leave your leveraged fund deep in the red, because the fund's d...