Dogecoin Rally Intensifies: Eyes Set On Historic New Highs
After a retracement from its current high of $0.22960, the price of Dogecoin (DOGE) looks like it is not yet done as the memecoin bounced back and moving toward its current high. Dogecoin Price Technical Analysis Dogecoi...
Archive context
Older archive item. Useful for background and entity history, but not a fresh market-moving signal.
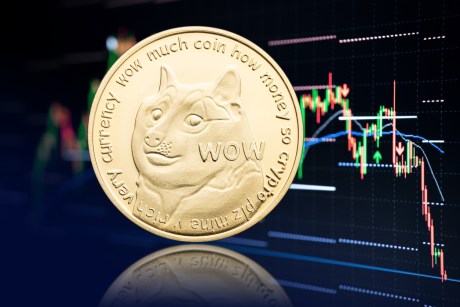
After a retracement from its current high of $0.22960, the price of Dogecoin (DOGE) looks like it is not yet done as the memecoin bounced back and moving toward its current high.
Dogecoin Price Technical AnalysisDogecoin is one of the few memecoins that have captured the hearts of many crypto investors. Like Shiba Inu and Pepecoin (PEPE), Dogecoin is backed up by a strong and exciting community which has played a huge role in its success so far.
At the time of writing, the price of DOGE was trading around $0.19713 and was up by over 5% in the last 24 hours. Also, the price is currently trading above the 100-day moving average with very strong bullish momentum in the 4-hour timeframe.
The MACD indicator in the 4-hour timeframe suggests an upward spike. This is so because the MACD line and the MACD signal that was trending below the zero line have both crossed, heading toward the MACD zero line.
If the MACD line and the MACD signal line manage to cross above the MACD zero, Dogecoin might move higher to create a new high. Meanwhile, the MACD histogram is already trending above the zero line which suggests a bullish momentum.
The Relative Strength Index (RSI) on the 4-hour timeframe also indicates a bullish momentum toward the upward direction as the RSI signal line has crossed above the 50% level and is heading towards the overbought zone. According to the RSI indicator, the strength of the upward movement is still very strong as buyers are still very active in the market.
Potential Retracement On The DownsideGiven the price’s previous surge, two major resistance levels and one major support level were created around $0.22960, $0.2244, and $0.19622 respectively. If the price of DOGE manages to move above the resistance level of $0.22441 level, it might move even further upward toward the resistance level of $0.22960.
At this point, if the price succeeds in breaking above this level, the price might surge higher to create a new high. On the other hand, if the price fails to break above this resistance level, the price might start a new downward movement toward its previous support level of $0.19622. However, a breakout below the $0.19622 level could trigger a new downward trend.
Why this matters
This altcoin story adds another data point to the current market tape and is useful when read alongside nearby source coverage.
Original source
Read on NewsBTCRelated market context

Bitcoin may seek 20-month trend line reclaim before new record highs: CryptoQuant
Bitcoin’s market cycle signals tool showed BTC price action copying history, possibly preparing to reclaim a key moving average be...

Google Gemini AI Predicts Bitcoin to Hit $175K by 2027
When prompted, Google Gemini AI predicts that by January 1, 2027, Bitcoin could be trading for $175,000. It gives a hypothetical c...

Claude AI Predicts that Chainlink (LINK) Could Hit Triple Digits in 2026
Claude AI predicts a wildly bullish price target for Chainlink (LINK), claiming it could reach $100 by January 1, 2027, if a near-...

XRP Price Could Surge 145% as 2023 Rally Pattern Returns
XRP price traded near $1.34 on October 16, about 4% below the 200-day simple moving average (SMA) at $1.36. The immediate test is...
Bitcoin steadies near $82,000 as Warsh declines to signal another Fed hike
Bitcoin's resilience amid market volatility highlights its potential as a hedge against economic uncertainty and shifting monetary...

Ethereum Price Prediction: ETH Outpaces the Market as Crypto Rebounds
Ethereum is outperforming the crypto market, rising by almost 3% over the past 24 hours to just a notch under $2,500 as digital as...