First Bullish Wick Appears On XRP Weekly Chart, And This Analyst Says It Will Send Price To $21.5
A lone green candle on XRP’s three-week chart is drawing attention from at least one analyst who believes it could be the start of something bigger than a routine bounce. Crypto analyst CW, posting on X, flagged a bullis...
Archive context
Older archive item. Useful for background and entity history, but not a fresh market-moving signal.

A lone green candle on XRP’s three-week chart is drawing attention from at least one analyst who believes it could be the start of something bigger than a routine bounce.
Crypto analyst CW, posting on X, flagged a bullish candlestick formation on the XRP/USD 3W chart that he says signals the opening of a full-scale uptrend. One that, if his cycle analysis holds, with the setup pointing first to a retest of the all-time high zone and then, in an extreme scenario, to $21.5.
New Uptrend Is Starting On The 3-Week ChartTechnical analysis of XRP’s price action on the 3-week candlestick timeframe chart is revealing an interesting signal. The signal itself is straightforward: a green candlestick has been printed on XRP’s three-week chart at a time when the price is sitting just above $1.38.
The analysis comes from crypto analyst CW, and according to this projection, this could be the first bullish wick that shows sellers are losing control on this higher timeframe.
It is important to note that the rally hasn’t kicked off yet, and XRP is still looking to solidify a break above $1.4. Also, indicators are yet to print full-scale uptrend signals, but according to the analyst, these bullish reversal signals will appear soon.
Those sub-indicators are visually consistent with a momentum oscillator cycling between oversold and overbought extremes shown in the chart below. They have printed blue dots at every significant XRP low since 2014, including the floors that preceded the 2017 and 2021 rallies. A new blue dot appears to be forming now.
Multi-Phase Cycle That Sends XRP Price To $21.5The chart attached to the analysis lays out two cycle structures divided into four separate phases. In the first cycle, Phase 1 was the initial markup, Phase 2 a massive correction, Phase 3 a prolonged descending consolidation inside a symmetrical triangle, and Phase 4 was a breakout.
The technical analysis places the current cycle as tracing the same sequence almost precisely. Phase 2 printed as the post-2021 bear market decline, Phase 3 as the multi-year compression between 2022 and 2024, and the surge to $3.65 as the first part of Phase 4 in the new cycle.
XRP is now, by this reading, still playing out Phase 4 into a move that overshoots everything that came before, despite being down by about 62% from its all-time high price. Interestingly, the chart also labels the first upside objective as a return to this all-time high.
Therefore, before any talk of double-digit prices, XRP would first need to reclaim the zone around its prior record of $3.65. CW’s final projection is a cycle top at $21.5, which he ties to the Fibonacci 6.618 extension level. That level is marked as TP2 on the chart, with the all-time high zone serving as TP1.
Why this matters
XRP is a tracked market entity in the DigitalMoneyBox archive, making this useful context for readers monitoring repeated mentions and follow-up coverage.
Original source
Read on NewsBTCRelated market context

Google Gemini AI Predicts Chainlink (LINK) Could Hit $100 in 2026
Google Gemini AI predicts that, with a landmark catalyst coming for Chainlink, the LINK token could surge to $100 by January 1, 20...

Sam Altman ChatGPT AI Predicts XRP Could Hit an Unbelievable Price by 2027
OpenAI’s ChatGPT AI predicts that if a monumental event lands for Ripple, XRP could surge to $50 or more. In this wildly bullish p...
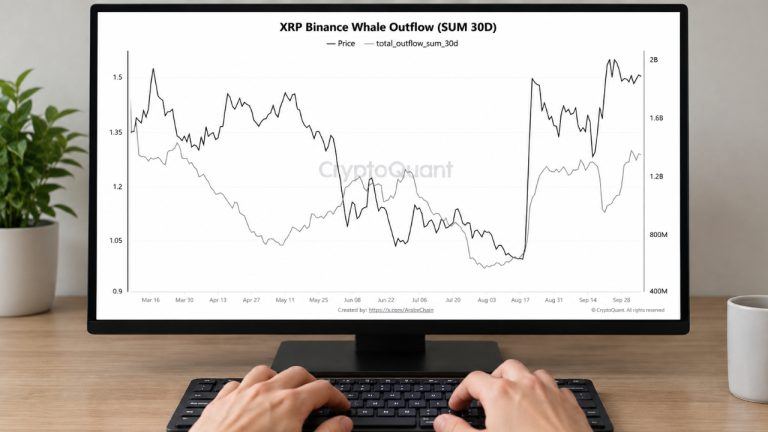
XRP Whale Transfers off Binance Reach Highest Level in 7 Months
XRP whale withdrawals from Binance have surged to a seven-month high, a new analysis shows, raising questions about available trad...

XRP Whales Dominate Exchange Outflows as Bitcoin Shorts Rise on Hyperliquid
The contrasting flows highlight a market where some large investors are moving XRP away from exchanges even as leveraged traders p...

Bitcoin pulls back as analysts forecast $80,000-$90,000 Q4 trading range
Bitcoin traded near $82,000 on Thursday, with analysts at QCP expecting a fourth-quarter range of $80,000 to $90,000.

Shawn Owen: Bitcoin’s First Institutional Cycle Has Arrived
Bitcoin Magazine Shawn Owen: Bitcoin’s First Institutional Cycle Has Arrived Banks and credit unions are racing to adopt Bitcoin,...