Head And Shoulders Alert: Dogecoin Could See A Price Crash Soon
Crypto analysts are sounding the alarm on Dogecoin as a classic chart pattern, known for predicting bearish trends, has emerged. Technical analyst Josh Olszewicz, @CarpeNoctom, flagged a potential Head and Shoulders (H&S...
Archive context
Older archive item. Useful for background and entity history, but not a fresh market-moving signal.

Crypto analysts are sounding the alarm on Dogecoin as a classic chart pattern, known for predicting bearish trends, has emerged. Technical analyst Josh Olszewicz, @CarpeNoctom, flagged a potential Head and Shoulders (H&S) formation on the DOGE/USD 12-hour chart on X, hinting at a possible significant price drop if the pattern validates.
The H&S pattern is a technical indicator traditionally viewed as a bearish signal within the trading community. The pattern is composed of three peaks, with the central peak (the head) being the highest and the two outside peaks (the shoulders) being lower and approximately equal in height. The line connecting the lowest points of the two troughs (the neckline) can be horizontal or sloped and represents a critical support level.
Dogecoin Must Hold $0.14In the case of Dogecoin’s 12-hour chart, the price has completed the left shoulder and the head, with the right shoulder currently forming. The neckline of this H&S pattern is identified at approximately $0.14, as annotated by Olszewicz. This level is crucial; a decisive break below could confirm the bearish forecast suggested by the H&S formation.
Another technical detail present on the chart is the Fibonacci retracement levels, which are horizontal lines indicating where support and resistance are likely to occur. They are based on Fibonacci numbers, a sequence famous in mathematics and nature for its proportionality.
Here, the 0.5 Fibonacci level aligns with the left shoulder around $0.18, while the 0 level coincides with the peak at approximately $0.23. These levels are key to determining the potential support and resistance areas in the market.
Olszewicz has also highlighted a projected target area based on the H&S pattern’s typical behavior. This bearish target is identified using the height of the pattern from the head’s peak to the neckline, projected downward from the point of the neckline break. The target box, marked in green, shows a potential decline to $0.10 to $0.09, coinciding with the 1.618 and 2.0 Fibonacci extension levels. A fall to this level could lead to a price crash of 40%.
The importance of the H&S pattern lies in its reliability as a trend reversal signal. It validates when the price breaks below the neckline following the formation of the right shoulder. For traders and investors alike, this pattern serves as a cautionary tale to brace for potential downside risks.
As of the latest chart by Olszewicz, the neckline has not been breached, and the pattern has yet to be confirmed. It is critical for observers to watch the $0.14 level closely, as a break below it would likely activate a sell-off, fulfilling the H&S prophecy. However, until such a break occurs, the pattern remains a watchful indicator rather than a confirmed trend reversal.
In summary, Dogecoin’s price chart is showing signs that could concern bullish investors. If history is any guide, the emerging H&S pattern, closely watched by analysts like Olszewicz, suggests a possible downward move in Dogecoin’s value in the near future. However, only a decisive break below the neckline will validate this pattern, turning a watchful eye into a bearish outlook.
At press time, DOGE traded at $0.1509.
Why this matters
This altcoin story adds another data point to the current market tape and is useful when read alongside nearby source coverage.
Original source
Read on NewsBTCRelated market context

XRP Price Could Surge 145% as 2023 Rally Pattern Returns
XRP price traded near $1.34 on October 16, about 4% below the 200-day simple moving average (SMA) at $1.36. The immediate test is...

Google Gemini AI Predicts Bitcoin to Hit $175K by 2027
When prompted, Google Gemini AI predicts that by January 1, 2027, Bitcoin could be trading for $175,000. It gives a hypothetical c...

Hot Inflation Data Puts Bitcoin Under Pressure, but ‘Difficult’ Isn’t ‘Bearish’: CoinShares
Bitcoin Magazine Hot Inflation Data Puts Bitcoin Under Pressure, but ‘Difficult’ Isn’t ‘Bearish’: CoinShares Bitcoin’s price has d...
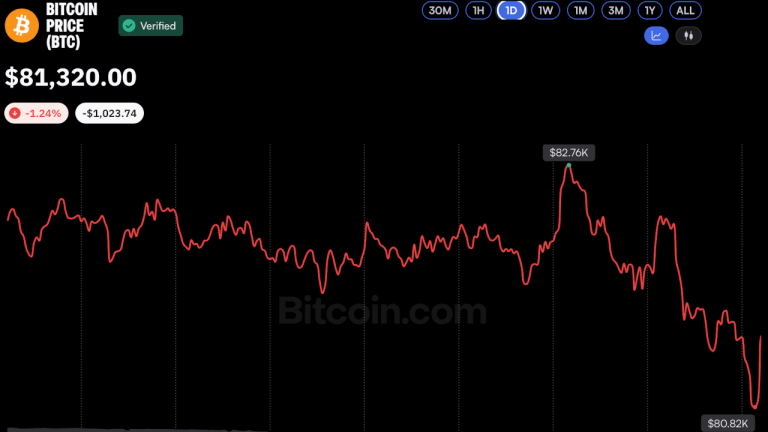
Bitcoin Price Hovers Near $81K as Analysts See Potential Market Bottom
Bitcoin slipped below $81,000 on Oct. 16 amid heightened market volatility, but analysts remained cautiously optimistic, suggestin...

Ethereum Price Prediction: ETH Outpaces the Market as Crypto Rebounds
Ethereum is outperforming the crypto market, rising by almost 3% over the past 24 hours to just a notch under $2,500 as digital as...

Bitcoin Reclaims $82,000 as VIX Jumps 22% and Nasdaq Slides Ahead of Black Monday Anniversary
Bitcoin recovered above $82,000 as the VIX surged 22% and the Nasdaq fell 2.15% ahead of the Black Monday anniversary, with ETF ou...