Optimism Price Prediction Targets $4.40 After Falling Wedge Breakout and Altcoin Rotation Setup
A breakout from a multi-month falling wedge pattern on the weekly chart has put the Layer-2 token back in focus. This bullish setup emerges at a time when capital is expected to rotate into L2 solutions amid a possible d...
Archive context
Older archive item. Useful for background and entity history, but not a fresh market-moving signal.

A breakout from a multi-month falling wedge pattern on the weekly chart has put the Layer-2 token back in focus. This bullish setup emerges at a time when capital is expected to rotate into L2 solutions amid a possible decline in Ethereum dominance. At the time of writing, OP trades at $0.79, representing a 2.52% decrease over the past 24 hours.
Falling Wedge Breakout Sparks Mid-to-Long-Term Bullish PotentialOn the weekly timeframe, OP/USDT has broken above the upper boundary of a falling wedge structure that had constrained its price action since late 2023. This pattern, known for indicating potential reversals, was breached with strong bullish momentum as the latest weekly candle closed decisively above resistance levels.
The breakout signals a change in the long-term trend and could set the foundation for an extended rally if supported by continued buying pressure and positive market sentiment.
Source: X
Analyst @manbitreal recently emphasized that Optimism could benefit from capital shifting into L2 ecosystems, particularly if Ethereum dominance declines. He noted that $0.82 is a critical resistance level and advised waiting for a confirmed breakout above it before initiating new long positions.
This aligns with the technical setup, where maintaining support above the breakout zone is essential for validating the pattern. Failure to stay above key pivot levels could result in renewed consolidation or pullback phases.
Market Activity and Resistance Zones Define the Road AheadThe 24-hour chart highlights mixed performance, with OP declining -2.52% but maintaining a volatile intraday range between $0.74 and $0.81. Despite the negative daily close, trading volume reached $473.76 million, suggesting significant engagement from market participants.
The data shows that bulls attempted to defend the $0.75–$0.78 support zone throughout the day, while sellers capped upside moves below $0.82. This level has now emerged as the immediate resistance that must be breached for the next leg upward.
Source: BraveNewCoin
With a current market cap of $1.37 billion, Optimism ranks as the 95th-largest cryptocurrency, placing it in the mid-cap category. Price consolidation near the $0.78 level will likely serve as the next short-term pivot.
A successful move above $0.82 could lead to challenges at $2.14, $2.46, and $2.66—key historical resistance zones that align with prior volume spikes and consolidation clusters. If these levels are surpassed, the $3.60–$4.40 range becomes a potential target for a supply zone in late Q3 or early Q4 2025.
Indicators Show Bullish Momentum With Caution on Short-Term PullbacksThe daily chart presents a stable bullish trend, with OP forming a series of higher lows and highs since early July. The MACD currently supports this structure, with its line reading 0.056 versus a signal line of 0.040, and a histogram value of 0.015. These metrics confirm the presence of upward momentum, although the histogram has yet to show sharp expansion, suggesting buyers are cautious amid resistance overhead.
Source: TradingView
The Chaikin Money Flow (CMF) indicator stands at +0.15, reflecting consistent capital inflow into OP. A rising CMF from negative territory earlier in the month confirms that demand has been steadily building. However, a drop in either the CMF or MACD alignment could hint at exhaustion and increase the likelihood of a retest of the $0.70–$0.72 support area.
Overall, the breakout from the falling wedge and sustained volume support signal that Optimism may be positioned for a longer-term bullish trajectory. Holding above $0.78 and clearing $0.82 remains crucial for validating this setup and moving toward the $4.40 target zone.
Why this matters
This altcoin story adds another data point to the current market tape and is useful when read alongside nearby source coverage.
Original source
Read on Brave New CoinRelated market context

XRP Price Prediction: Elliott Wave Setup Points to $3 as XRP Nears a Potential $2 Breakout
XRP Price Prediction: Elliott Wave Setup Points to $3 as XRP Nears a Potential $2 Breakout XRP is approaching a critical technical...

Bitcoin’s rebound approaches the $85,000 zone where past buyers may sell
Bitcoin and Ethereum extended their weekend recovery, although on-chain indicators and derivatives positioning suggest the rebound...

SUI Crypto Up +2% Following $30M DATA Network Investment
SUI crypto trades at $1.12, up +2.2% over 24 hours, as traders weigh a sharp recent rebound against overhead resistance. The Sui F...

Anthropic’s Claude AI Predicts a Wild Price for Chainlink (LINK)
Anthropic’s Claude AI predicts that in a peak bull-market setup, Chainlink (LINK) could hit $150–$250 by January 1, 2027, with a s...
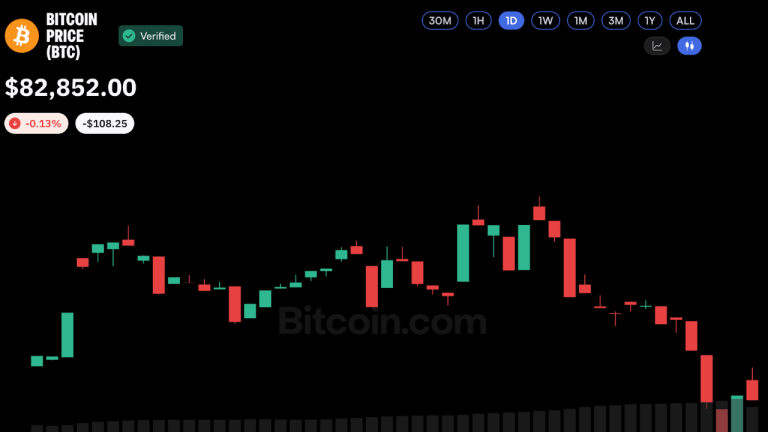
Bitcoin Price Defies $681M ETF Outflow as Oil Trades Above $100
Bitcoin is holding above $80,000 even as Brent crude trades above $100 amid renewed Middle East tensions. The resilience is notabl...
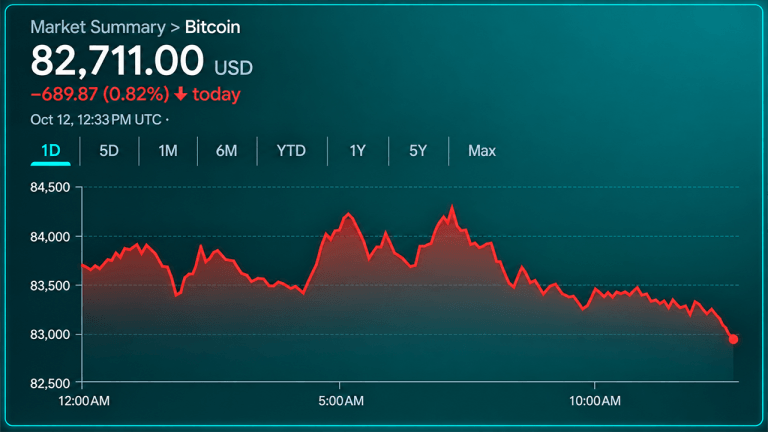
Bitcoin Price Walks a Tightrope as Bears Circle the $82K Zone
Bitcoin’s price hovered around $82,550 to $83,000 on Monday, Oct. 12, 2026, as technical indicators painted a largely neutral pict...