Pattern That Led To Dogecoin Price 36,000% Surge In 2021 Has Emerged Again, Will History Repeat?
Dogecoin just endured a sharp weekend drawdown, slipping back below the $0.20s after failing to extend its early October rebound. This decline was enough to wipe out many weeks of steady gains and shake retail sentiment....
Archive context
Older archive item. Useful for background and entity history, but not a fresh market-moving signal.

Dogecoin just endured a sharp weekend drawdown, slipping back below the $0.20s after failing to extend its early October rebound. This decline was enough to wipe out many weeks of steady gains and shake retail sentiment. However, amid the volatility, the monthly chart is still bullish. Despite the weekend crash, Dogecoin is well above its 25-month moving average and is trading near the same structural zone that preceded past parabolic rallies.
This setup caught the attention of a technical analyst on X known as EᴛʜᴇʀNᴀꜱʏᴏɴᴀL, who pointed out that the same pattern that preceded Dogecoin’s 36,000% breakout in 2021 has now resurfaced.
Historical Structure Reappears On Dogecoin’s ChartAccording to the analyst’s long-term monthly chart, Dogecoin has repeatedly entered explosive bull runs after exhibiting three major technical conditions: a breakout from a prolonged falling trend, sustained trading above the 25MA, and a successful retest phase that confirms structural strength. Each of these setups has led to massive price expansions, most notably the 36,000% surge that catapulted DOGE from fractions of a cent to its May 2021 all-time high of $0.7316.
As shown in the chart below, the same technical conditions are playing out again. The falling trendline that had capped Dogecoin’s growth since mid-2021 has already been broken, and the price is well positioned above the 25MA. The ongoing consolidation is representing the retest phase, the same period that preceded the last two major parabolic runs in 2017 and 2021.
Another important observation highlighted by the analyst is that each historical breakout was preceded by what is referred to as the NGMI (Not Gonna Make It) phase. This is typically when Dogecoin is trading sideways or dipping slightly after breaking out of its multi-month falling trendline.
Will History Repeat For DOGE?As it stands, Dogecoin’s monthly price pattern is now back to trading around this downward trendline, which it broke above in late 2024. The latest candlestick wick, which was created with Dogecoin’s recent fall to $0.18, saw it touching this trendline again very briefly.
However, if Dogecoin’s recurring structural pattern continues to play out as it has before, the current downtrend phase might precede another strong rally. The technical alignment, a combination of price stability above the 25MA, the breakout from a long-term downtrend, and the retest confirmation, means that momentum is still quietly building beneath the surface.
Although no chart can guarantee a repetition of the 2021 magnitude, EᴛʜᴇʀNᴀꜱʏᴏɴᴀL’s technical outlook provides a compelling argument that Dogecoin’s larger bullish cycle is still intact.
At the time of writing, Dogecoin is trading at $0.201, down by 5.2% and 23% in the past 24 hours and seven days, respectively.
Why this matters
This altcoin story adds another data point to the current market tape and is useful when read alongside nearby source coverage.
Original source
Read on NewsBTCRelated market context

XRP Price Prediction: Elliott Wave Setup Points to $3 as XRP Nears a Potential $2 Breakout
XRP Price Prediction: Elliott Wave Setup Points to $3 as XRP Nears a Potential $2 Breakout XRP is approaching a critical technical...
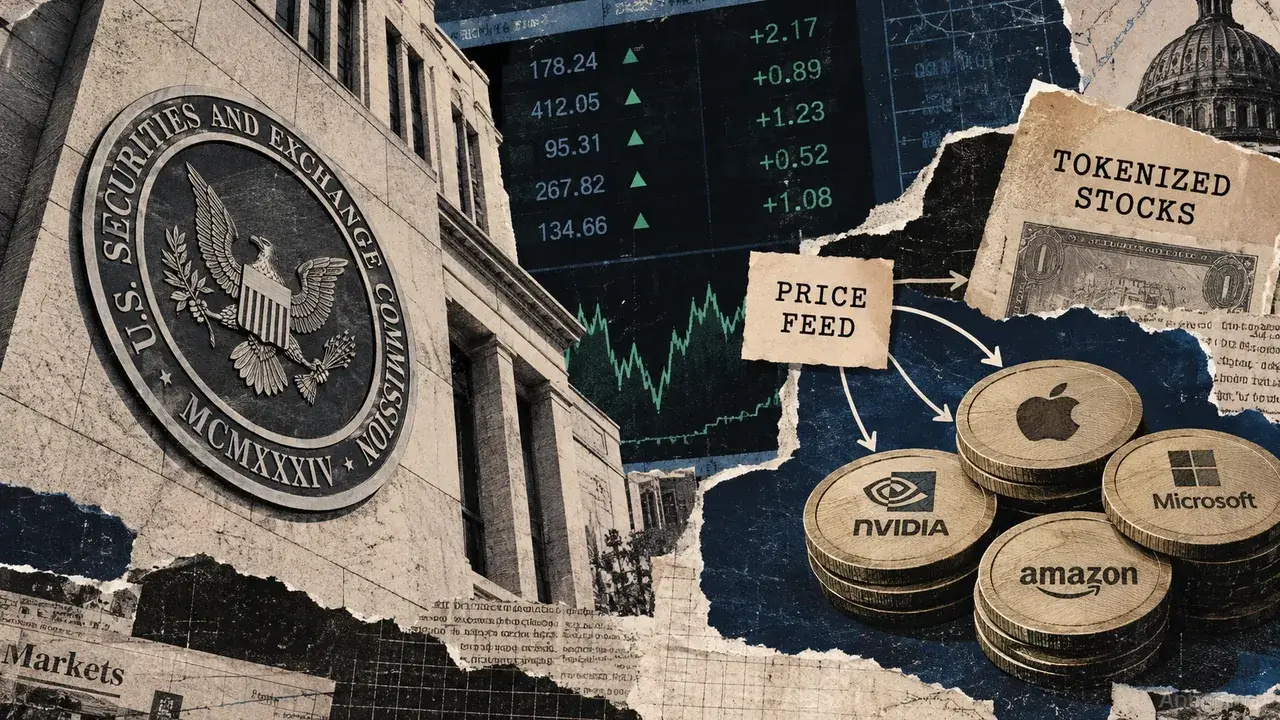
Tokenized stocks can carry the same rights without the same trading protections
Tokenized stocks eligible for the SEC’s September exemption must carry equivalent shareholder rights, yet their trading venues can...

Bitcoin Price Prediction: Can BTC USD Hold $82K Ahead of Next Week’s CPI Drop?
Bitcoin price prediction notes a brief recovery on Saturday, October 10, but the market remains poised for a weekly loss as rising...

What Is Crypto Spot Trading?
For example, a token can be up 70% and still be a terrible trade if you have no idea when to take profits. Likewise, a 30% dip can...

Meta AI Predicts This Huge Catalyst Could Lead to $40 XRP
Mark Zuckerberg’s Meta AI predicts an insanely wild bullish price target for XRP by January 1, 2027. The AI bot believes $25–$40 i...
Solana captures 65% of tokenized equities trading volume
Solana's dominance in tokenized equities highlights the growing shift towards decentralized finance, challenging traditional stock...