SOL Price Breaks $100 – Why Solana Could Pump Another 10%
Solana is gaining bullish momentum above $100. SOL price is signaling a fresh increase and might rally further toward the $112 level. SOL price started a fresh increase from the $93.20 support against the US Dollar. The...
Archive context
Older archive item. Useful for background and entity history, but not a fresh market-moving signal.

Solana is gaining bullish momentum above $100. SOL price is signaling a fresh increase and might rally further toward the $112 level.
- SOL price started a fresh increase from the $93.20 support against the US Dollar.
- The price is now trading above $98 and the 100 simple moving average (4 hours).
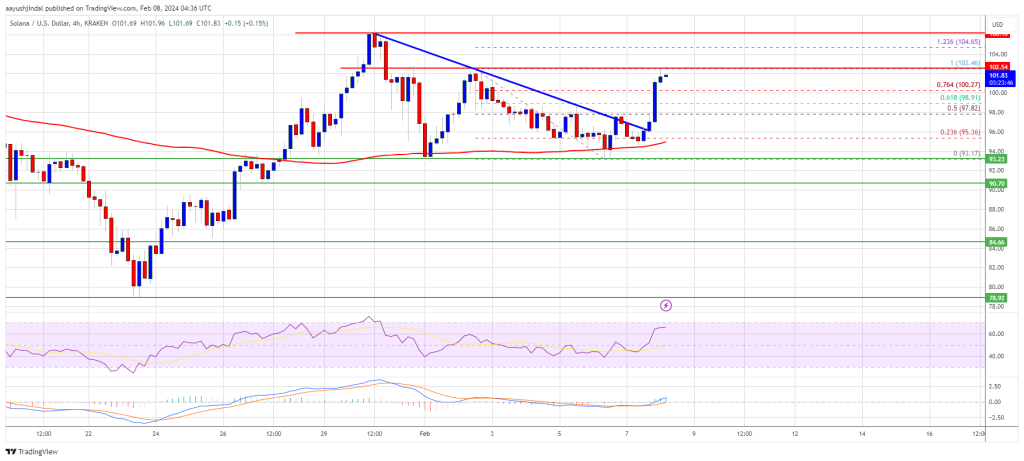
- There was a break above a major bearish trend line with resistance at $96 on the 4-hour chart of the SOL/USD pair (data source from Kraken).
- The pair could continue to rally if it clears the $102.50 and $105.00 resistance levels.
Solana price formed a base above the $93.20 support zone and recently started a fresh increase. There was a decent increase above the $96 and $98 levels.
The price is up over 7% and there was a move above the $100 level, outperforming Bitcoin and Ethereum. During the increase, the price cleared the 76.4% Fib retracement level of the downward move from the $102.46 swing high to the $93.17 low.
Besides, there was a break above a major bearish trend line with resistance at $96 on the 4-hour chart of the SOL/USD pair. Solana is now trading above $98 and the 100 simple moving average (4 hours).
Source: SOLUSD on TradingView.com
Immediate resistance is near the $102.50 level. The next major resistance is near the $105 level. A successful close above the $105 resistance could set the pace for another major increase. The next key resistance is near $112. Any more gains might send the price toward the $120 level.
Are Dips Supported in SOL?If SOL fails to rally above the $105 resistance, it could start a downside correction. Initial support on the downside is near the $98 level.
The first major support is near the $96 level and the 100 simple moving average (4 hours), below which the price could test $93.20. If there is a close below the $93.20 support, the price could decline toward the $85 support in the near term.
Technical Indicators
4-Hours MACD – The MACD for SOL/USD is gaining pace in the bullish zone.
4-Hours RSI (Relative Strength Index) – The RSI for SOL/USD is above the 50 level.
Major Support Levels – $96, and $93.20.
Major Resistance Levels – $102.50, $105, and $112.
Why this matters
This altcoin story adds another data point to the current market tape and is useful when read alongside nearby source coverage.
Original source
Read on NewsBTCRelated market context

Ethereum Price Prediction: ETH Outpaces the Market as Crypto Rebounds
Ethereum is outperforming the crypto market, rising by almost 3% over the past 24 hours to just a notch under $2,500 as digital as...

Claude AI Predicts that Chainlink (LINK) Could Hit Triple Digits in 2026
Claude AI predicts a wildly bullish price target for Chainlink (LINK), claiming it could reach $100 by January 1, 2027, if a near-...

Ethereum lacks bullish catalyst despite Binance leverage reset: CryptoQuant
The leverage reset enhances market stability, but sustained growth hinges on fresh capital inflows and increased institutional int...

Circle minted another ~750 million USDC on Solana in the last 24 hours
Increased USDC minting on Solana may boost its DeFi activity and influence market perceptions of Solana's growth and competitive s...

XRP Price Prediction: XRP Duo Turn Bullish, $1,000 Dream Lives On
XRP is trading at $1.34, up more than 1% after a brutal Wednesday. Ripple CEO Brad Garlinghouse says XRP has legal clarity despite...

Bitcoin Price Prediction: Bitcoin Tracks Treasury Real Rates, Fidelity Finds
Bitcoin is trading at $82,000, rebounding from $80,000 since yesterday morning, as traders weigh a new macro signal that could fli...