Solana Explodes Out Of Downtrend: How High Can It Go?
Solana (SOL) has delivered a dramatic shift in market structure, breaking above a descending parallel channel that had dominated its price action for several weeks. Ali Martinez (@ali_charts), who shared the attached fou...
Archive context
Older archive item. Useful for background and entity history, but not a fresh market-moving signal.

Solana (SOL) has delivered a dramatic shift in market structure, breaking above a descending parallel channel that had dominated its price action for several weeks. Ali Martinez (@ali_charts), who shared the attached four-hour chart, suggests that this breakout could position the token for a potential climb toward $213.
Solana Bulls Regain MomentumThe chart, which spans from January into early March, shows a steadily declining pattern where price repeatedly tested and respected both the upper and lower boundaries of the channel before the latest bullish push propelled SOL beyond the channel’s resistance.
The descending parallel channel highlighted in Martinez’s analysis is visually evident from a series of lower highs and lower lows, forming a consistent downward slope. Each brief recovery in previous weeks failed to clear the channel’s midline, reinforcing bearish pressure. However, once SOL’s price managed to rise above this midline, bullish momentum began to build, culminating in a decisive move through the upper boundary. This kind of channel breakout often suggests that sellers have been exhausted, allowing buyers to take control of the market.
Notably, the breakout comes with two major catalysts for Solana. First, the massive Solana unlock by the FTX estate is done (March 1). Second, yesterday, US President Donald Trump announced the inclusion of Bitcoin, Ethereum, XRP, Cardano and Solana in the United States’ Strategic Crypto Reserve.
One of the most critical elements in Martinez’s forecast is the $213 target, which is derived from the channel’s height from the breakout point in combination with 0.382 Fibonacci retracement level. Currently, in the aftermath of a breakout, a retest of the broken resistance is taking place —to turn it into support. The $160-165 zone is the area where buyers might attempt to defend the token’s new uptrend.
To the upside, the key Fibonacci retracement levels above Solana’s current price of $170.19 are $174.11 (0.618), $192.62 (0.5), $213.11 (0.382), and $241.50 (0.236), with the full retracement level at $295.60 (0.0) serving as the ultimate bullish target based on the chart’s structure.
The overall sentiment among analysts supports Martinez’s bullish outlook. Jelle (@CryptoJelleNL) pointed to the significant Solana unlock event that is now behind us and underscored the fact that the weekly candle closed in the green. According to his observations, SOL has reclaimed crucial support after taking out its lows, with a trendline that continues to hold firmly.
“Massive $SOL unlock behind us, and the weekly candle closed in the green. Lows taken out, support retested, trendline holding. Pretty sure the next SOL push sends it into price discovery – hard,” he writes via X.
Adding to the positive market narrative, Chris Burniske, a partner at Placeholder VC, remarked via X that BTC, ETH, and SOL all posted favorable weekly closes and that the long-term trend across these leading cryptocurrencies remains to the upside. “BTC ETH and SOL couldn’t have asked for better closes on the weeklies. The long term trend remains: UP,” Burniske says.
From a technical perspective, much hinges on Solana’s ability to sustain its breakout. The descending channel had functioned as a clear reference for bearish sentiment, and breaching it suggests a significant change in the market’s psychology.
At press time, SOL traded at $164.
Why this matters
This altcoin story adds another data point to the current market tape and is useful when read alongside nearby source coverage.
Original source
Read on NewsBTCRelated market context

Google Gemini AI Predicts Bitcoin to Hit $175K by 2027
When prompted, Google Gemini AI predicts that by January 1, 2027, Bitcoin could be trading for $175,000. It gives a hypothetical c...
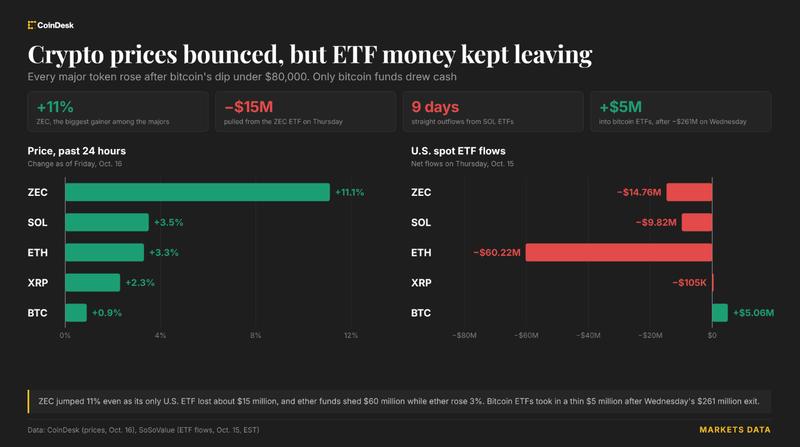
Live updates: Bitcoin back above $82,000, ZEC jumps 11% as ETF outflows continue
Crypto bounced a day after bitcoin’s brief drop under $80,000, but investors kept pulling money from ether, SOL and ZEC funds.

XRP Price Prediction: XRP Duo Turn Bullish, $1,000 Dream Lives On
XRP is trading at $1.34, up more than 1% after a brutal Wednesday. Ripple CEO Brad Garlinghouse says XRP has legal clarity despite...

The 7 Best USDC on Solana to XMR Swap Platforms in 2026
Swapping USDC on Solana for Monero (XMR) offers a fast, low-cost route into a privacy-focused asset. Leading platforms in 2026 pro...

Ethereum lacks bullish catalyst despite Binance leverage reset: CryptoQuant
The leverage reset enhances market stability, but sustained growth hinges on fresh capital inflows and increased institutional int...

Bitcoin Price Prediction: Bitcoin Tracks Treasury Real Rates, Fidelity Finds
Bitcoin is trading at $82,000, rebounding from $80,000 since yesterday morning, as traders weigh a new macro signal that could fli...