Solana Hits $170, Bullish Channel Formation Indicates Possible Rally
The cryptocurrency market has witnessed significant fluctuation, with Solana (SOL) experiencing a notable retracement to $170.27, creating a bullish channel in the process. This recent market behavior happens after a per...
Archive context
Older archive item. Useful for background and entity history, but not a fresh market-moving signal.

The cryptocurrency market has witnessed significant fluctuation, with Solana (SOL) experiencing a notable retracement to $170.27, creating a bullish channel in the process. This recent market behavior happens after a period of a potential rally that has previously pushed the price of SOL above the $170.27 level.
As the price of this digital asset continues to trend within the channel, the question remains whether bulls will regain control and push the price above the bullish channel or will the bears maintain their dominance and drive the price below it. In this article, we will examine Solana’s recent price movements using technical indicators to forecast future trends and highlight key levels to watch.
Technical Examination On The Current Price Movement Of SolanaOn the 4-hour chart, Solana’s price is currently above the 100-day Simple Moving Average (SMA), suggesting a potential resurgence of bullish momentum for SOL. Additionally, the price has faced resistance at the $170 mark, as indicated by two bullish candlesticks signaling this rejection.
The signal line of the 4-hour Relative Strength Index (RSI) indicator, which recently dipped slightly below 50%, is now attempting to cross back above the 50% mark. If successful, this cross could indicate a potential price increase for Solana.
On the 1-hour chart, Solana is climbing toward the 100-day Simple Moving Average (SMA), indicating a potential upward movement as it may attempt to break above the level. Also, SOL’s price has established a bullish channel pattern on the 1-hour chart.
A breakout and close above the channel’s upper line could ignite positive sentiment, as the bulls may regain control. Lastly, the signal line of the RSI indicator on the 1-hour chart is also currently approaching the 50% mark, suggesting possible upward momentum.
Key Levels To Watch In The Event of A BreakoutConsidering the current positive rebound at $170, if the price of Solana breaks and closes above the upper boundary of the bullish channel, it may continue its rally toward the $188 resistance range. Should Solana manage to surpass this resistance level, it could lead to an additional upward move, pushing towards $205 along with other resistance points beyond.
Nonetheless, if Solana’s price breaks and closes below the channel’s lower boundary, it could decline to the $160 support level. Should the price break and close below $160, it might trigger further bearish momentum, pushing the price toward the $118 support range or even lower.
As of the time of writing, Solana’s price has decreased by 0.72%, trading at approximately $173 over the past 24 hours. The cryptocurrency has a market capitalization of over $80 billion and a trading volume exceeding $3 billion. There has been a 0.71% decline in SOL’s market cap, accompanied by a 7.10% increase in trading volume over the last 24 hours.
Why this matters
This altcoin story adds another data point to the current market tape and is useful when read alongside nearby source coverage.
Original source
Read on NewsBTCRelated market context

Bitcoin (BTC) Price Prediction: Glassnode Signals Potential Price Floor Near $80K as Sellers Capitulate
Similar spikes in Bitcoin’s realized losses preceded local price bottoms in August and September, raising the possibility that the...

Stablecoin Remittances Cost a Fraction of Traditional Channels as Solana Postpones Shanghai Event and OpenAI Model Raises Wallet Security Concerns
Stablecoin remittances cost a median 1% versus 6.36% for traditional channels, Solana postpones Shanghai event, and an OpenAI mode...

XRP Price Could Surge 145% as 2023 Rally Pattern Returns
XRP price traded near $1.34 on October 16, about 4% below the 200-day simple moving average (SMA) at $1.36. The immediate test is...

The 7 Best USDC on Solana to XMR Swap Platforms in 2026
Swapping USDC on Solana for Monero (XMR) offers a fast, low-cost route into a privacy-focused asset. Leading platforms in 2026 pro...
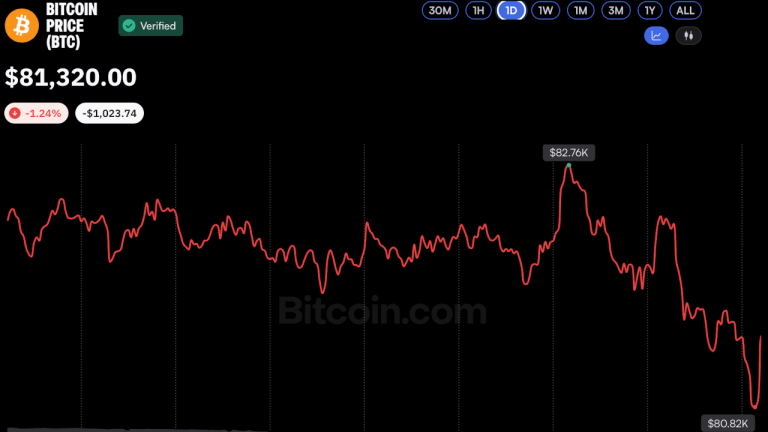
Bitcoin Price Hovers Near $81K as Analysts See Potential Market Bottom
Bitcoin slipped below $81,000 on Oct. 16 amid heightened market volatility, but analysts remained cautiously optimistic, suggestin...

ChatGPT AI Predicts Million-Dollar Bitcoin by 2027
ChatGPT AI predicts Bitcoin will hit $1M+, which isn’t a crazy call, since many analysts share the same view. What makes this pred...