Solana Price (SOL) Slips to $140: Will This Level Support a Rebound?
Solana started a downside correction from the $162 resistance zone. SOL price is back to $140 and might attempt a fresh increase above $150. SOL price started a downside correction below the $155 and $150 levels the US D...
Archive context
Older archive item. Useful for background and entity history, but not a fresh market-moving signal.

Solana started a downside correction from the $162 resistance zone. SOL price is back to $140 and might attempt a fresh increase above $150.
- SOL price started a downside correction below the $155 and $150 levels the US Dollar.
- The price is now trading below $150 and the 100-hourly simple moving average.
- There was a break below a rising channel with support at $154 on the hourly chart of the SOL/USD pair (data source from Kraken).
- The pair could start another increase if it clears the $150 resistance zone.
Solana price started a downside correction after it failed to clear the $162 zone. SOL dipped below the $155 support level and moved into a short-term bearish zone like Bitcoin and Ethereum.
There was a break below a rising channel with support at $154 on the hourly chart of the SOL/USD pair. The pair dipped below the $145 level. It even tested the $140 zone. A low was formed at $141.29 and the price is now consolidating losses.
Solana is now trading well below $150 and the 100-hourly simple moving average. On the upside, the price is facing resistance near the $145 level. It is close to the 23.6% Fib retracement level of the downward move from the $158 swing high to the $141 low.
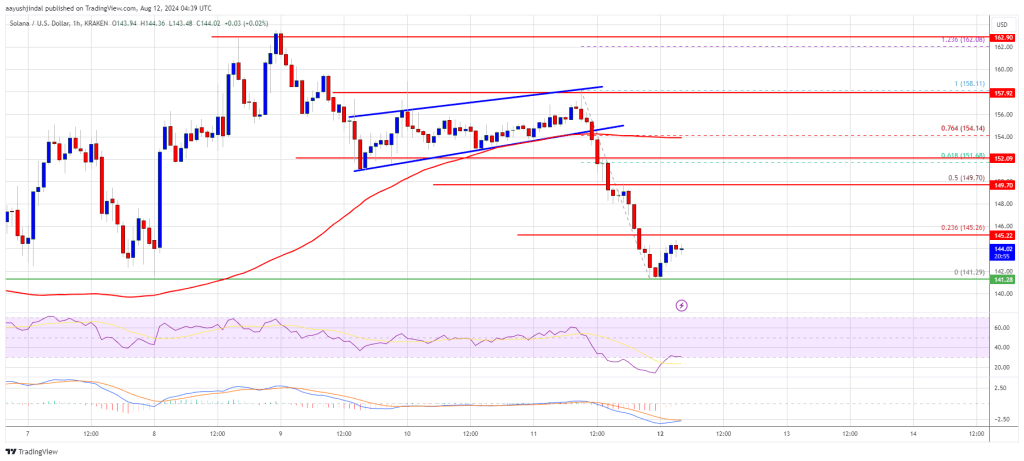
The next major resistance is near the $150 level or the 50% Fib retracement level of the downward move from the $158 swing high to the $141 low. A successful close above the $150 resistance could set the pace for another steady increase. The next key resistance is near $155. Any more gains might send the price toward the $162 level.
More Downsides in SOL?If SOL fails to rise above the $150 resistance, it could start another decline. Initial support on the downside is near the $142 level. The first major support is near the $140 level.
A break below the $140 level might send the price toward $132. If there is a close below the $132 support, the price could decline toward the $124 support in the near term.
Technical Indicators
Hourly MACD – The MACD for SOL/USD is losing pace in the bearish zone.
Hourly Hours RSI (Relative Strength Index) – The RSI for SOL/USD is below the 50 level.
Major Support Levels – $142 and $135.
Major Resistance Levels – $150 and $155.
Why this matters
This altcoin story adds another data point to the current market tape and is useful when read alongside nearby source coverage.
Original source
Read on NewsBTCRelated market context

Bitcoin (BTC) Price Prediction: Glassnode Signals Potential Price Floor Near $80K as Sellers Capitulate
Similar spikes in Bitcoin’s realized losses preceded local price bottoms in August and September, raising the possibility that the...

Bitcoin Price Forecast: $81,500 Leaves Weekly Close Needing a Big Push
Sunday’s (October 18) Bitcoin price forecast puts it near $ 81,600, with technical indicators sending mixed signals. Shorter-term...

The 7 Best USDC on Solana to XMR Swap Platforms in 2026
Swapping USDC on Solana for Monero (XMR) offers a fast, low-cost route into a privacy-focused asset. Leading platforms in 2026 pro...

Pump.fun pairs 0% Solana trades with a 0.45% app fee it plans to give away
Pump.fun's fee strategy prioritizes user growth and engagement over immediate profits, potentially reshaping competitive dynamics...

USDC Network Fees in 2026: Ethereum vs Solana vs Other Chains, Priced to the Cent
A USDC balance is the same dollar on every chain Circle issues it on. Moving it is not the same price. In October 2026 the spread...

XRP Price Could Surge 145% as 2023 Rally Pattern Returns
XRP price traded near $1.34 on October 16, about 4% below the 200-day simple moving average (SMA) at $1.36. The immediate test is...