Solana (SOL) Breakdown Accelerates At $90, $80 Suddenly Looks Vulnerable
Solana failed to settle above $102 and extended losses. SOL price is now consolidating losses below $95 and might struggle to start a recovery wave. SOL price started a fresh decline below $100 and $95 against the US Dol...
Archive context
Older archive item. Useful for background and entity history, but not a fresh market-moving signal.

Solana failed to settle above $102 and extended losses. SOL price is now consolidating losses below $95 and might struggle to start a recovery wave.
- SOL price started a fresh decline below $100 and $95 against the US Dollar.
- The price is now trading below $100 and the 100-hourly simple moving average.
- There is a key bearish trend line forming with resistance at $98 on the hourly chart of the SOL/USD pair (data source from Kraken).
- The price could start a recovery wave if the bulls defend $90 or $85.
Solana price failed to remain stable above $105 and started a fresh decline, like Bitcoin and Ethereum. SOL declined below the $100 and $95 support levels.
The price gained bearish momentum below $92. A low was formed at $89, and the price is now consolidating losses with a bearish angle below the 23.6% Fib retracement level of the downward move from the $106 swing high to the $89 low.
Solana is now trading below $95 and the 100-hourly simple moving average. On the upside, immediate resistance is near the $93 level. The next major resistance is near the $97 level or the 50% Fib retracement level of the downward move from the $106 swing high to the $89 low. There is also a key bearish trend line forming with resistance at $98 on the hourly chart of the SOL/USD pair.
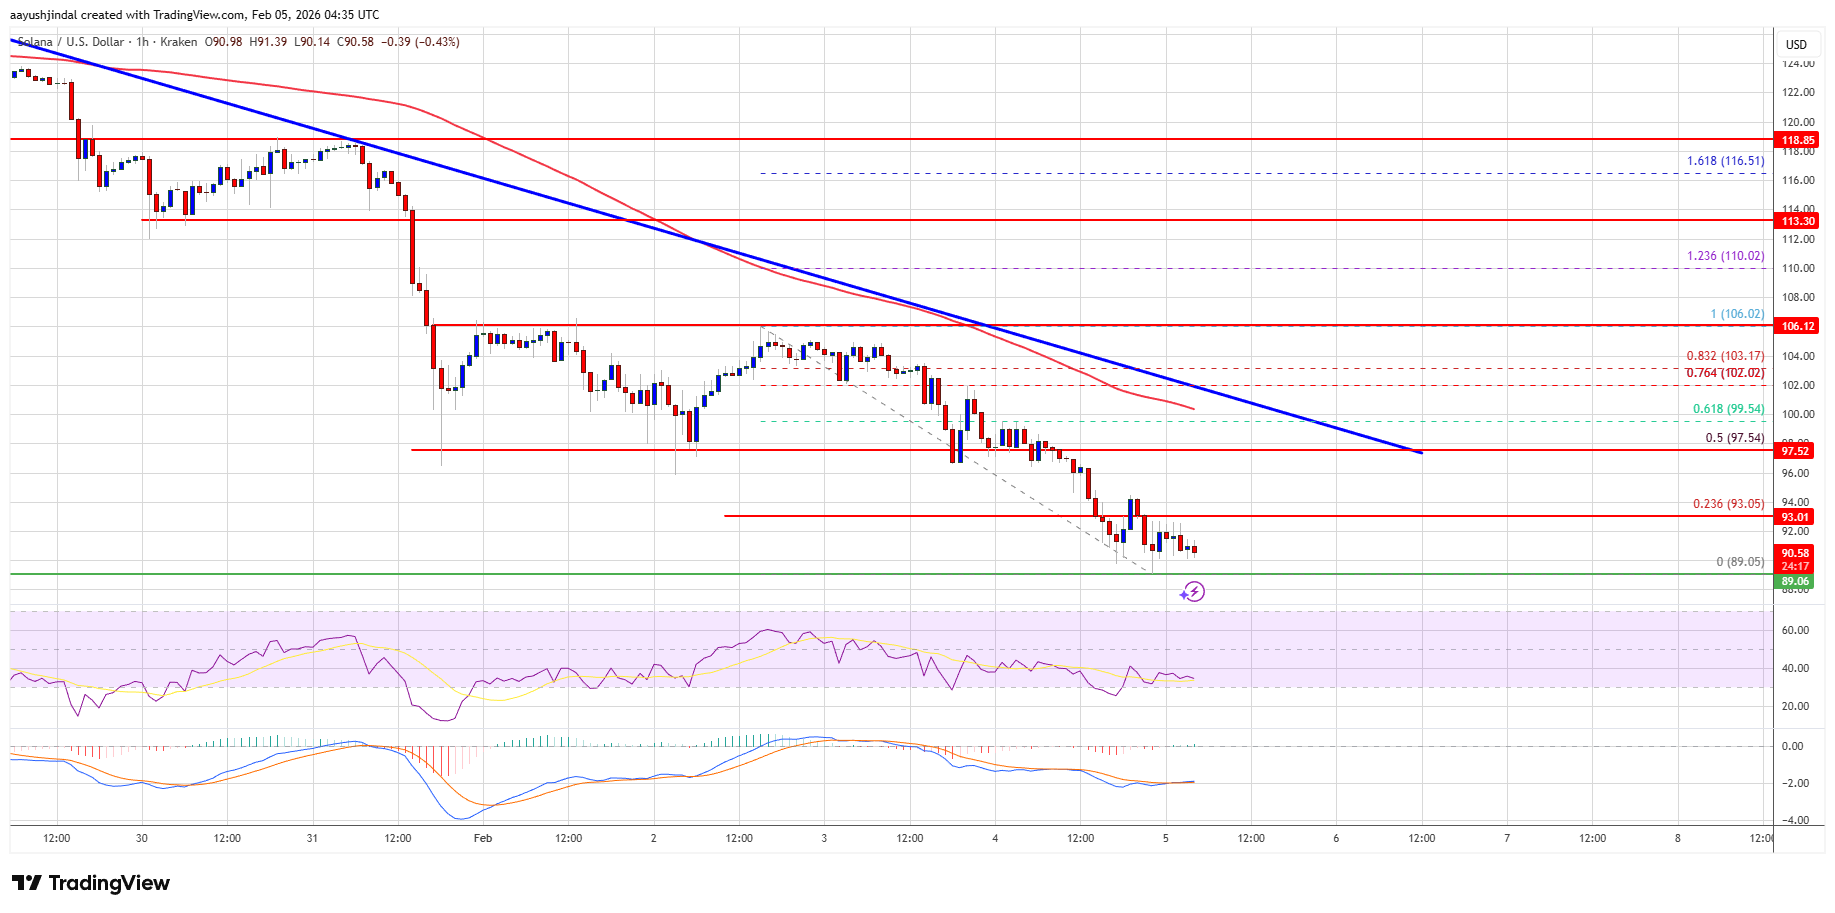
The main resistance could be $102. A successful close above the $102 resistance zone could set the pace for another steady increase. The next key resistance is $106. Any more gains might send the price toward the $112 level.
More Losses In SOL?If SOL fails to rise above the $98 resistance, it could continue to move down. Initial support on the downside is near the $90 zone. The first major support is near the $85 level.
A break below the $85 level might send the price toward the $82 support zone. If there is a close below the $82 support, the price could decline toward the $74 support in the near term.
Technical Indicators
Hourly MACD – The MACD for SOL/USD is gaining pace in the bearish zone.
Hourly Hours RSI (Relative Strength Index) – The RSI for SOL/USD is below the 50 level.
Major Support Levels – $90 and $85.
Major Resistance Levels – $98 and $102.
Why this matters
Solana is a tracked market entity in the DigitalMoneyBox archive, making this useful context for readers monitoring repeated mentions and follow-up coverage.
Original source
Read on NewsBTCRelated market context

Ethereum (ETH) Price Prediction: ETH Eyes Recovery From $2,600 as $2,666-$2,689 Becomes Resistance
Ethereum price is holding around $2,618 as buyers attempt to preserve the latest recovery, but the market is approaching a decisiv...

Ethereum Price Prediction: Layer-2 Trouble Deepens as Another Network Shuts Down
Blast’s decision to close its Layer-2 network sharpens the question of Ethereum price and prediction: does activity ultimately con...

Ethereum holds near $2,700 as $414.1 million in longs sit in liquidation zones
Ethereum trades near $2,700 as $148.3 million in crypto positions are liquidated and $414.1 million in ETH longs sit in liquidatio...

Ethereum falls 6%, leaving $1.35 billion in long bets at risk of liquidation
Ethereum’s slide toward $2,500 has put about $1.35 billion of leveraged long positions at increasing risk of liquidation. CoinMark...

Elon Musk Grok AI Predicts Bitcoin Could Hit $1M by 2027
Elon Musk’s Grok AI predicts a wild price target for Bitcoin through the end of 2026, claiming that in a full-blown bull market, c...

XRP Whales Dominate Exchange Outflows as Bitcoin Shorts Rise on Hyperliquid
The contrasting flows highlight a market where some large investors are moving XRP away from exchanges even as leveraged traders p...