Solana (SOL) Keeps $100 Alive, Recovery Push Faces First Test
Solana failed to settle above $112 and extended losses. SOL price is now recovering above $102 but faces many hurdles near $108 and $110. SOL price started a decent recovery wave above $100 and $102 against the US Dollar...
Archive context
Older archive item. Useful for background and entity history, but not a fresh market-moving signal.

Solana failed to settle above $112 and extended losses. SOL price is now recovering above $102 but faces many hurdles near $108 and $110.
- SOL price started a decent recovery wave above $100 and $102 against the US Dollar.
- The price is now trading below $110 and the 100-hourly simple moving average.
- There is a key bearish trend line forming with resistance at $108 on the hourly chart of the SOL/USD pair (data source from Kraken).
- The price could continue to move up if it clears $108 and $110.
Solana price remained stable and started a decent recovery wave from $95, like Bitcoin and Ethereum. SOL was able to climb above the $100 level.
There was a move above the 23.6% Fib retracement level of the downward move from the $119 swing high to the $95.81 low. However, the bears are active below $110. There is also a key bearish trend line forming with resistance at $108 on the hourly chart of the SOL/USD pair.
Solana is now trading below $105 and the 100-hourly simple moving average. On the upside, immediate resistance is near the $108 level, the trend line, and the 50% Fib retracement level of the downward move from the $119 swing high to the $95.81 low.
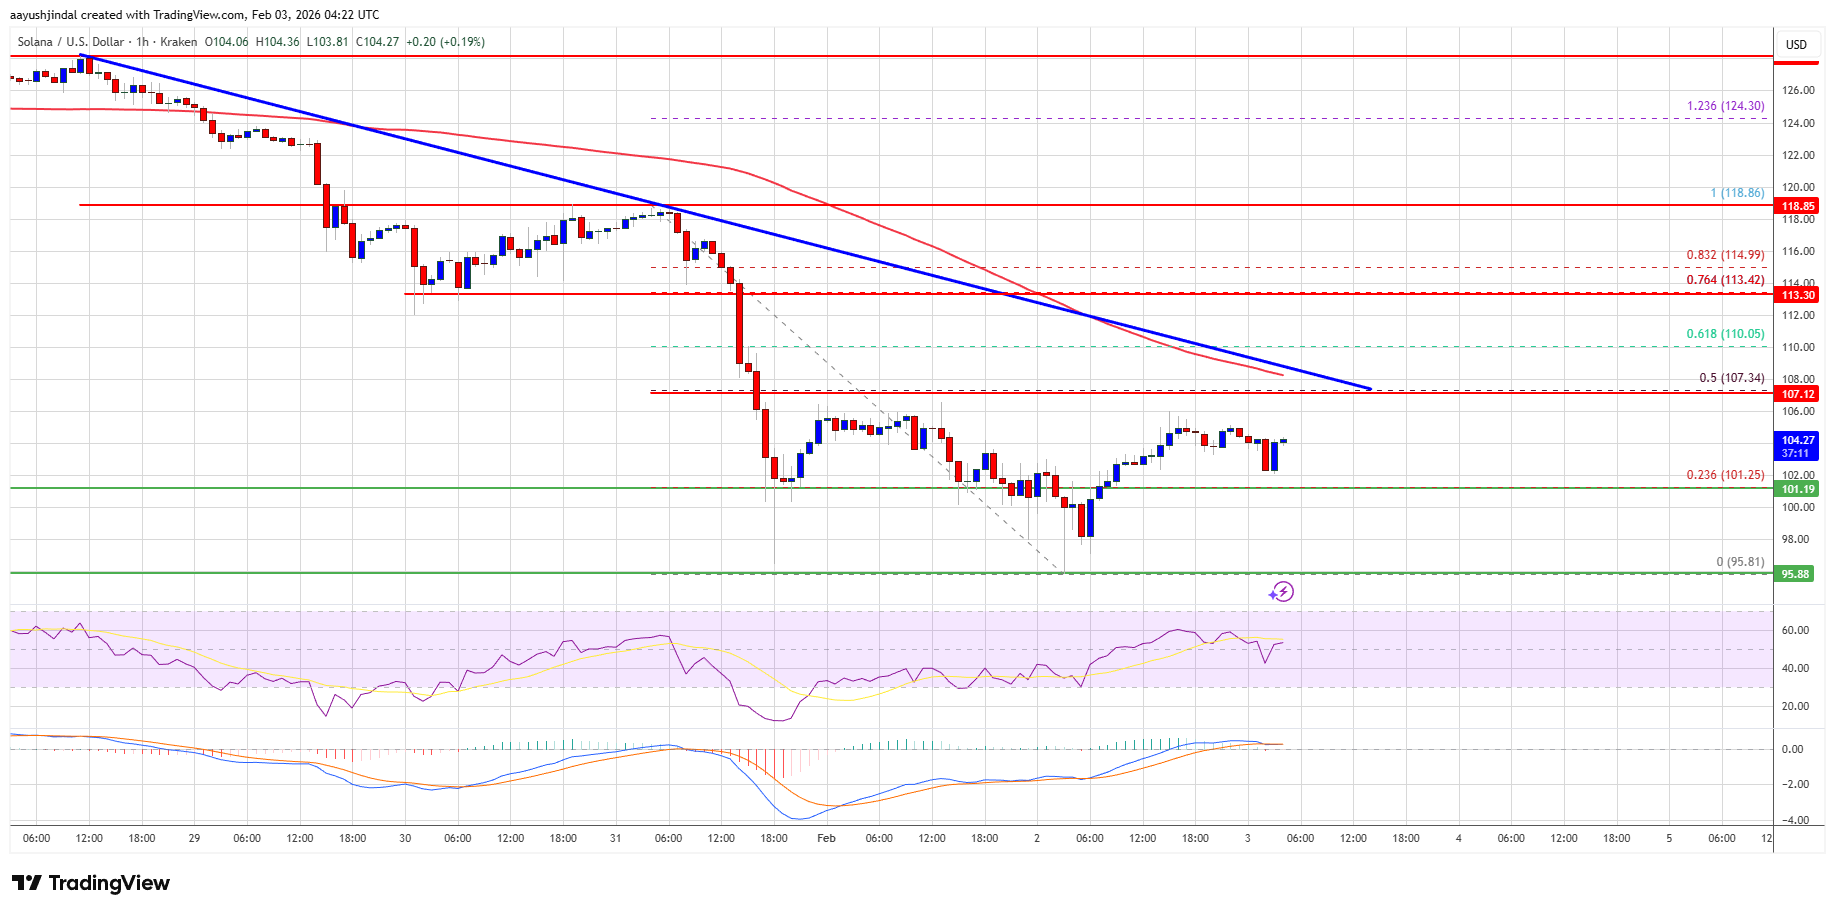
The next major resistance is near the $110 level. The main resistance could be $115. A successful close above the $115 resistance zone could set the pace for another steady increase. The next key resistance is $122. Any more gains might send the price toward the $125 level.
Another Decline In SOL?If SOL fails to rise above the $108 resistance, it could continue to move down. Initial support on the downside is near the $101 zone. The first major support is near the $95 level.
A break below the $95 level might send the price toward the $88 support zone. If there is a close below the $88 support, the price could decline toward the $80 zone in the near term.
Technical Indicators
Hourly MACD – The MACD for SOL/USD is gaining pace in the bullish zone.
Hourly Hours RSI (Relative Strength Index) – The RSI for SOL/USD is above the 50 level.
Major Support Levels – $101 and $95.
Major Resistance Levels – $108 and $115.
Why this matters
Solana is a tracked market entity in the DigitalMoneyBox archive, making this useful context for readers monitoring repeated mentions and follow-up coverage.
Original source
Read on NewsBTCRelated market context

Ethereum Price and $1.16B Selling Threat: North Korea’s Binance Hacker Moves $137M
Ethereum price is facing another challenge as a North Korea-linked hacker moves $137 million in ETH. The massive transfer comes as...

Crypto News Today: Bitcoin MVRV Near 1.1 Signals Possible Bottom as ETH and XRP Join Market Recovery
Bitcoin (BTC) traded at $64,946.14 after recovering from an early session low near $64,357. Ethereum (ETH) and XRP each gained 1.0...

Solana Drops “Mainnet Beta” Label as Foundation Introduces Protocol Version 1.0
TL;DR The Solana Foundation has retired the mainnet-beta designation and introduced protocol version 1.0. SOL balances, transactio...

Sam Altman’s ChatGPT AI Predicts an Explosive 2027 for ETH
Ethereum trades near $1,780–$1,820 in mid-November 2026, well below its 2025 peak. Yet Sam Altman’s ChatGPT AI predicts a single t...

Binance Hack Wallets Move $137 Million in Ethereum After Two Weeks of Silence
A wallet linked to October’s record Binance theft moved $63 million in ether, before analysts flagged a larger wave of transfers a...

CoinGecko Gets Solana Foundation Backing and Plans Solana-Powered Trading
CoinGecko, one of the most widely used crypto price and market data sites, has a new backer in the Solana Foundation, the nonprofi...