Solana (SOL) Momentum Builds: $250 Could Just Be The Beginning
Solana started a fresh increase from the $220 zone. SOL price is rising and aiming for a sustained upward move above the $250 resistance. SOL price started a fresh increase after it settled above the $225 level against t...
Archive context
Older archive item. Useful for background and entity history, but not a fresh market-moving signal.

Solana started a fresh increase from the $220 zone. SOL price is rising and aiming for a sustained upward move above the $250 resistance.
- SOL price started a fresh increase after it settled above the $225 level against the US Dollar.
- The price is now trading above $240 and the 100-hourly simple moving average.
- There was a break above a key bearish trend line with resistance at $240 on the hourly chart of the SOL/USD pair (data source from Kraken).
- The pair could start a fresh increase if the bulls clear the $250 zone.
Solana price formed a support base and started a fresh increase above the $225 level like Bitcoin and Ethereum. There was a decent increase above the $230 and $232 resistance levels.
There was a move above the 50% Fib retracement level of the downward move from the $256 swing high to the $221 low. Besides, there was a break above a key bearish trend line with resistance at $240 on the hourly chart of the SOL/USD pair.
Solana is now trading above $240 and the 100-hourly simple moving average. On the upside, the price is facing resistance near the $244 level or the 61.8% Fib retracement level of the downward move from the $256 swing high to the $221 low.

The next major resistance is near the $248 level. The main resistance could be $250. A successful close above the $250 resistance level could set the pace for another steady increase. The next key resistance is $265. Any more gains might send the price toward the $278 level.
Are Dips Supported in SOL?If SOL fails to rise above the $248 resistance, it could start a downside correction. Initial support on the downside is near the $240 level or the 100-hourly simple moving average. The first major support is near the $232 level.
A break below the $232 level might send the price toward the $230 zone. If there is a close below the $230 support, the price could decline toward the $220 support in the near term.
Technical Indicators
Hourly MACD – The MACD for SOL/USD is gaining pace in the bullish zone.
Hourly Hours RSI (Relative Strength Index) – The RSI for SOL/USD is above the 50 level.
Major Support Levels – $240 and $232.
Major Resistance Levels – $248 and $250.
Why this matters
This altcoin story adds another data point to the current market tape and is useful when read alongside nearby source coverage.
Original source
Read on NewsBTCRelated market context

Ethereum Price Prediction: Is the $60,000 ETH Forecast Realistic?
Ethereum trades at $2,390, down 2% over 24 hours, with the price still confined to a broad range. A $60,000 Ethereum price predict...

Bitcoin (BTC) Price Prediction: BlackRock’s $663M ETF Inflow Reverses October Outflows—Can BTC Break the $90K Barrier?
The development offered a fresh bullish signal as Bitcoin traded within $81.185–$82,954, although questions remain about whether d...

Bitcoin Price Prediction: Strategy Slapped the Buy Button Amid MSCI Delisting Rumours
Strategy added Bitcoin even as an MSCI delisting review put its funding model under scrutiny. BTC traded at $81,500 after recoveri...

Ethereum staking hits record as yields fall and Solana activity grows: Bitwise
A record 43.8 million ETH, nearly 36% of supply, was staked in Q3 as yields fell to 2.63%. Solana staking hit a record 440.5 milli...
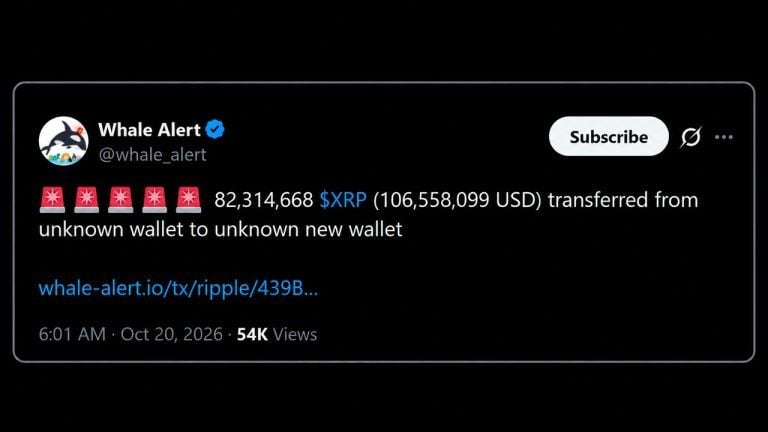
XRP Whale That Stacked Above $2 Just Moved 82 Million Tokens
An XRP wallet that took in nearly 300 million XRP while the token traded around $2 sent 82.3 million XRP, worth about $106.6 milli...

Bitcoin spot ETFs see $526.6 million inflows on October 19 as Ethereum and Solana funds bleed
Bitcoin ETF inflows highlight BlackRock's dominance, while Ethereum and Solana outflows suggest shifting investor preferences and...