Solana (SOL) Under Pressure As Downtrend Looks Ready To Resume
Solana failed to settle above $90 and trimmed some gains. SOL price is now facing hurdles near $88 and might decline again below $82. SOL price started a decent recovery wave above $78 and $82 against the US Dollar. The...
Archive context
Older archive item. Useful for background and entity history, but not a fresh market-moving signal.

Solana failed to settle above $90 and trimmed some gains. SOL price is now facing hurdles near $88 and might decline again below $82.
- SOL price started a decent recovery wave above $78 and $82 against the US Dollar.
- The price is now trading below $85 and the 100-hourly simple moving average.
- There is a key bearish trend line forming with resistance at $85 on the hourly chart of the SOL/USD pair (data source from Kraken).
- The price could continue to move up if it clears $85 and $90.
Solana price remained stable and started a decent recovery wave above $72, like Bitcoin and Ethereum. SOL was able to climb above the $80 level.
There was a move above the 50% Fib retracement level of the downward move from the $106 swing high to the $68 low. However, the bears are active near $90. The price is now moving lower below $88. There is also a key bearish trend line forming with resistance at $85 on the hourly chart of the SOL/USD pair.
Solana is now trading below $85 and the 100-hourly simple moving average. On the upside, immediate resistance is near the $85 level and the trend line. The next major resistance is near the $92 level and the 61.8% Fib retracement level of the downward move from the $106 swing high to the $68 low.
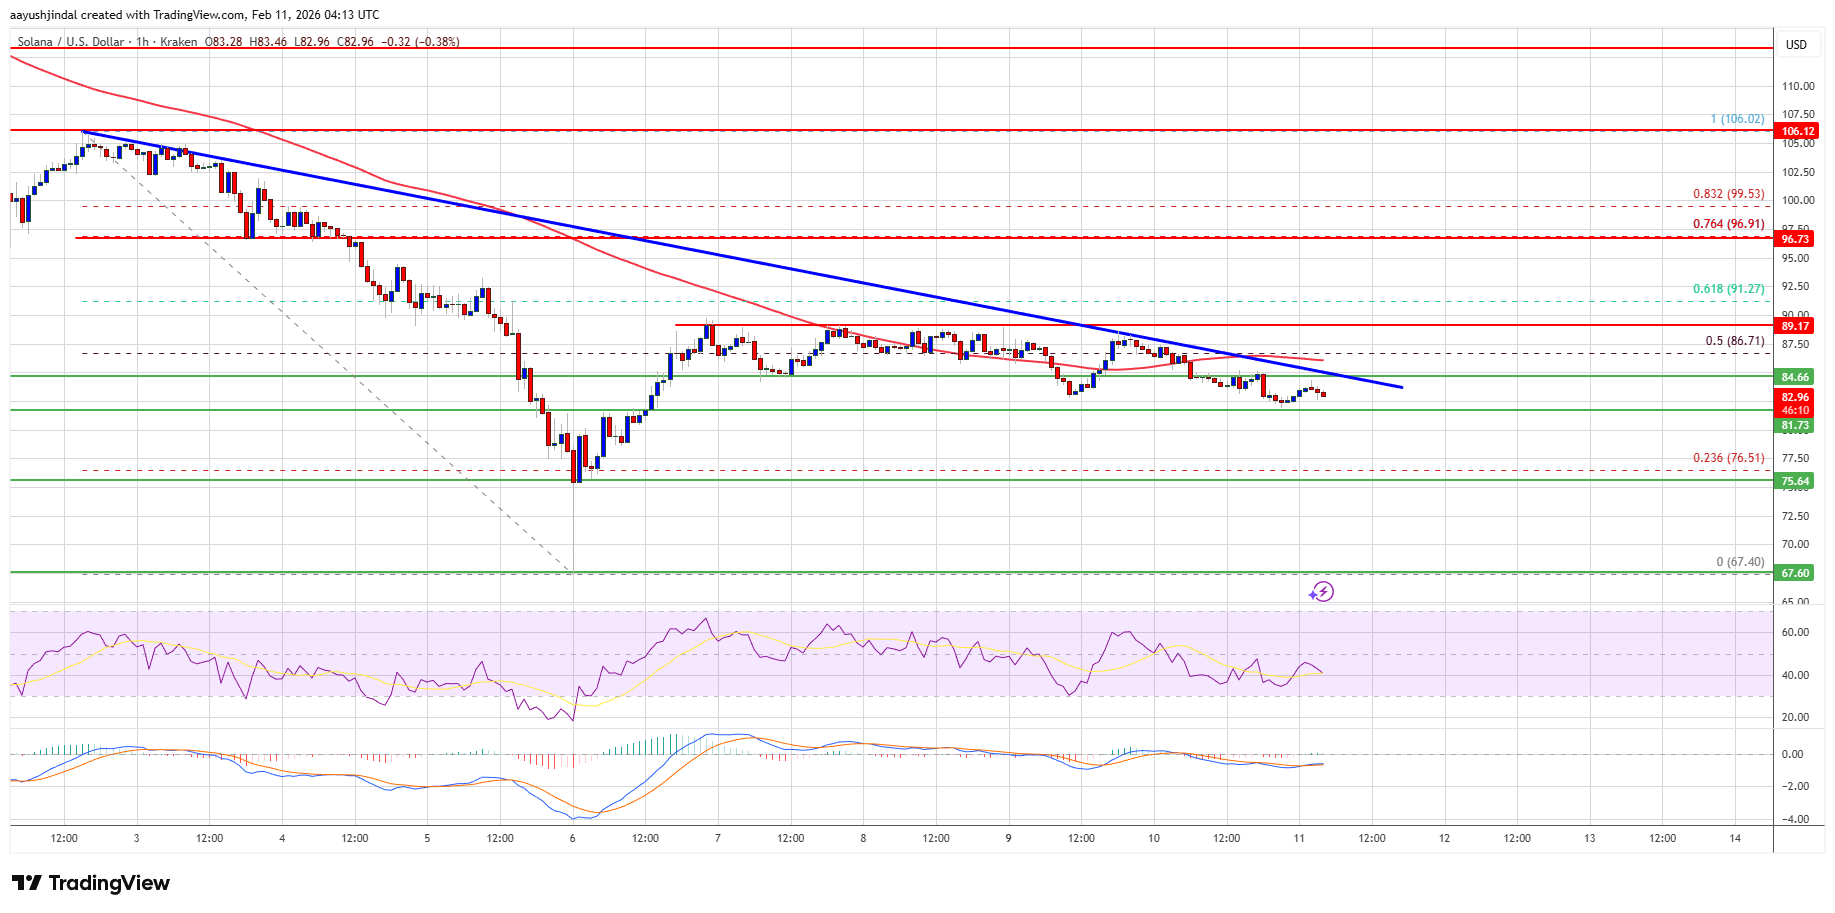
The main resistance could be $96. A successful close above the $96 resistance zone could set the pace for another steady increase. The next key resistance is $105. Any more gains might send the price toward the $112 level.
Downside Continuation In SOL?If SOL fails to rise above the $85 resistance, it could continue to move down. Initial support on the downside is near the $82 zone. The first major support is near the $80 level.
A break below the $80 level might send the price toward the $75 support zone. If there is a close below the $75 support, the price could decline toward the $70 zone in the near term.
Technical Indicators
Hourly MACD – The MACD for SOL/USD is gaining pace in the bearish zone.
Hourly Hours RSI (Relative Strength Index) – The RSI for SOL/USD is below the 50 level.
Major Support Levels – $82 and $75.
Major Resistance Levels – $85 and $92.
Why this matters
Solana is a tracked market entity in the DigitalMoneyBox archive, making this useful context for readers monitoring repeated mentions and follow-up coverage.
Original source
Read on NewsBTCRelated market context

Ethereum (ETH) Price Prediction: ETH Eyes Recovery From $2,600 as $2,666-$2,689 Becomes Resistance
Ethereum price is holding around $2,618 as buyers attempt to preserve the latest recovery, but the market is approaching a decisiv...

Ethereum Price Prediction: Layer-2 Trouble Deepens as Another Network Shuts Down
Blast’s decision to close its Layer-2 network sharpens the question of Ethereum price and prediction: does activity ultimately con...

Ethereum falls 6%, leaving $1.35 billion in long bets at risk of liquidation
Ethereum’s slide toward $2,500 has put about $1.35 billion of leveraged long positions at increasing risk of liquidation. CoinMark...

Why Abstract is killing its Ethereum L2 instead of launching a token to save it
Abstract will shut down on Dec. 15 despite onboarding more than 400,000 users, hosting 144 apps, and landing brands including Disn...

Ethereum Tests 200 Million Gas Limit On Sepolia As Glamsterdam Moves Forward
TL;DR: Ethereum’s Sepolia testnet is testing a 200 million block gas limit as part of work around the Glamsterdam upgrade. The exp...

US Government Moves $103M in Seized Bitcoin and BNB to Coinbase Prime, Raising Sale Questions
The Bitcoin and BNB transactions drew attention because Coinbase Prime provides institutional custody and trading services for dig...