Technical Convergence Puts XRP Profit Target Between $8.43 And $13.58
Crypto analyst Bobby A has published a four-panel roadmap that ties together Bitcoin dominance, US small-caps, XRP’s monthly price structure, and XRP’s total market capitalization. The overlapping signals, he argues, ide...
Archive context
Older archive item. Useful for background and entity history, but not a fresh market-moving signal.

Crypto analyst Bobby A has published a four-panel roadmap that ties together Bitcoin dominance, US small-caps, XRP’s monthly price structure, and XRP’s total market capitalization. The overlapping signals, he argues, identify a well-defined take-profit band for XRP between roughly $8.43 and $13.58. “Four charts to rule them all,” he wrote, adding that the market is “clearly positioning itself for higher prices.”
Four Charts Signal XRP $8.43–$13.58 PeakOn the XRP/USD monthly chart, Bobby plots a multi-month consolidation which is built above “Base Camp 1” and, more recently, above “Base Camp 2.” The structure sits on top of a series of higher lows marked on the chart, with the consolidation developing after price reclaimed long-term moving-average clusters and the upper Bollinger band expanded.
The Fibonacci extension grid anchored to the prior cycle shows 1.618 at approximately $5.26, 2.618 at about $8.43, 3.618 near $11.66, and 4.236 at roughly $13.58. Bobby labels the $8.43–$13.58 span as the “Take Profit Zone,” aligning it with the 2.618–4.236 extensions that capped previous euphoric runs on the same timeframe.
Beneath the candles, the monthly momentum suite is turning higher: the RSI sits in a positive regime “preparing to initiate one final move toward overbought territory,” while stochastic and MACD lines have curled up from mid-range, consistent with trend continuation rather than exhaustion.
That price-based roadmap is cross-checked against XRP’s total market capitalization on the weekly timeframe. Here, Bobby highlights “price acceptance above the 2018 peak surrounded by skepticism and uncertainty” and annotates “over 300 days consolidating above 2018 highs.”
The Fibonacci projection on market cap places the 1.618 extension near ~$210.7 billion, with a boxed “Take Profit Zone” parked just below the ultimate extension band and an overhead dashed guide around ~$13.00 that visually rhymes with the 4.236 price extension on the USD chart. The message of this pane is less about day-to-day candles and more about location: a lengthy basing and re-accumulation phase above a historic ceiling, which converts that ceiling into support and sets up measured-move targets.
Macro risk appetite is addressed in the third panel via the iShares Russell 2000 ETF (IWM) on the monthly chart. “IWM 1M is firing on all cylinders, and new ATHs are inbound regardless of any short-term noise,” Bobby writes.
The chart shows a strong bullish candle reclaiming the 0.786–0.886 retracement area and pressing back into the prior range top around $244–$252. Upside Fibonacci targets are mapped at 1.272 ~$267.1, 1.414 ~$278.9, and 1.618 ~$296.8. The RSI, stochastic oscillator, and MACD on this timeframe are all pointed higher, with Bobby calling the breakout candle “very telling,” the kind of multi-indicator alignment he says “occurs only a few times per decade.” The implication is that a risk-on tone in US small-caps historically pairs well with liquidity rotating into higher-beta crypto segments.
The final piece is Bitcoin dominance (BTC.D) on the weekly chart. Bobby’s retracement panel measures the advance from ~38.9% to ~66.1% share and now shows BTC.D slipping beneath the 23.6% line (~59.7%) and hovering near the 38.2% (~55.5%).
Notably, the BTC.D slipped below an ascending channel. Based on that, he draws a downward arrow toward the 50% level (~52.3%) and then into the 61.8% retracement (~49.1%), with a target rectangle in the mid-to-low-40s bracketed by the 78.6% (~45.9%) and 88.6% (~43.2%) levels.
“BTC.D will inevitably initiate a move toward the mid to low 40% zone,” he writes. A decline in dominance of that magnitude typically coincides with capital rotating from Bitcoin into large-cap altcoins—precisely the regime in which XRP has historically captured outsized relative performance.
At press time, XRP traded at $2.84.
Why this matters
This altcoin story adds another data point to the current market tape and is useful when read alongside nearby source coverage.
Original source
Read on NewsBTCRelated market context

Meta AI Predicts This Huge Catalyst Could Lead to $40 XRP
Mark Zuckerberg’s Meta AI predicts an insanely wild bullish price target for XRP by January 1, 2027. The AI bot believes $25–$40 i...

Sam Altman ChatGPT AI Predicts Bitcoin to Hit Insane All-Time High in 2026
Sam Altman’s ChatGPT AI predicts Bitcoin could reach a new all-time high in 2026, nearly doubling its October 2025 high of $126,00...

Luxor’s reported 6–13% annualized Bitcoin yield depends on mining delivery
Luxor, a Bitcoin mining derivatives provider, reported a 6–13% annualized Bitcoin financing spread in its September lookback, publ...

Solana token holder net income holds above $400K for two weeks
Sustained net income growth for Solana token holders highlights the network's potential for profitability, yet underscores volatil...
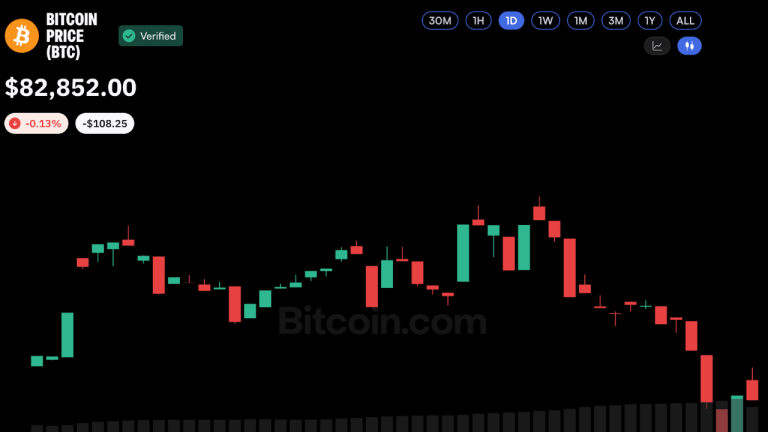
Bitcoin Price Defies $681M ETF Outflow as Oil Trades Above $100
Bitcoin is holding above $80,000 even as Brent crude trades above $100 amid renewed Middle East tensions. The resilience is notabl...

SUI Crypto Up +2% Following $30M DATA Network Investment
SUI crypto trades at $1.12, up +2.2% over 24 hours, as traders weigh a sharp recent rebound against overhead resistance. The Sui F...