What Does The Bull Div On Ethereum RSI Mean For The Top Altcoin?
Just like other altcoins, Ethereum too extended losses today. Over the last 24 hours, the altcoin slipped below the $1900 price level. Bitcoin also fell on its chart and major industry altcoins followed suit. Most coins...
Archive context
Older archive item. Useful for background and entity history, but not a fresh market-moving signal.

Just like other altcoins, Ethereum too extended losses today. Over the last 24 hours, the altcoin slipped below the $1900 price level. Bitcoin also fell on its chart and major industry altcoins followed suit. Most coins over the past week and a half have been consolidating on their charts.
Following the consolidation, some altcoins attempted to rise on their charts but was soon met with the bears due to choppiness in the market. Overhead resistance for Ethereum continues to remain firm for the coin as market remains weak.
Buyers are still wary of their next step as ETH witnessed fluctuations in price level. Amidst bearish price action, Ethereum has managed to capture a bullish signal on the one day chart. If demand grows back, the coin could regain a bullish stance over the upcoming trading sessions.
Ethereum Price Analysis: One Day Chart Ethereum was priced at $1800 on the one day chart | Source: ETHUSD on TradingViewETH was exchanging hands at $1800 after it encountered stiff resistance at the $1900 price level. Over the last 24 hours, Ethereum lost 2.6% of its value. In the past week, ETH depreciated by almost 10%. A fall from the current price level will make ETH trade near the $1700 price mark.
Ethereum was back to trading at the price levels it last traded in the month of July 2021. Overhead resistance for the coin awaited at $1960. If demand remains consistent the altcoin could push itself to trade near the $2000 price mark.
The volume of Ethereum declined a little but the bar was red in colour. The red bar signified a bearish price action.
Technical Analysis Ethereum displayed bullish divergence on the RSI on the one day chart | Source: ETHUSD on TradingViewThe altcoin despite a fall in price noted considerable uptick in the number of buyers in the market. This signal paints optimism for the coin for the upcoming trading sessions. The Relative Strength Index noted a bullish divergence (Yellow).
This occurs when despite a price fall, buying strength increases in the market. This is a sign of upcoming bullishness. The RSI was headed towards the half-line although even at press time sellers outnumbered buyers in the market.
In correspondence to the same reading, Ethereum was pushing hard to rise above the 20-SMA. If it manages to maintain a buying strength the push can cause buyers to drive the price momentum in the market.
Related Reading | TA: Ethereum Fails Near Key Resistance, Why $1,700 Is The Key
Ethereum registered a buy signal on the one day chart | Source: ETHUSD on TradingViewThe altcoin continued to display that the bulls still haven’t completely faded. The Moving Average Convergence Divergence is supposed to read the price momentum and changes in the same. MACD underwent a bullish crossover and portrayed green signal bars.
The green signal bars are tied to a buy signal. If demand helps Ethereum, buyers can push price to $2000. The Parabolic SAR however, showed a trend reversal as the dotted lines moved above the price candlesticks. This is tied with bearishness in the market.
The Parabolic SAR however, is not always reliable while reading trend changes.
Related Reading | Glassnode: Bitcoin Long-Term Holders Own 90% Of Supply In Profit
Why this matters
This altcoin story adds another data point to the current market tape and is useful when read alongside nearby source coverage.
Original source
Read on NewsBTCRelated market context

One year after 10/10, Bitcoin and Ether liquidity is back while altcoins lag
The crypto market's bifurcation highlights Bitcoin and Ether's institutional appeal, while altcoins face volatility and limited gr...
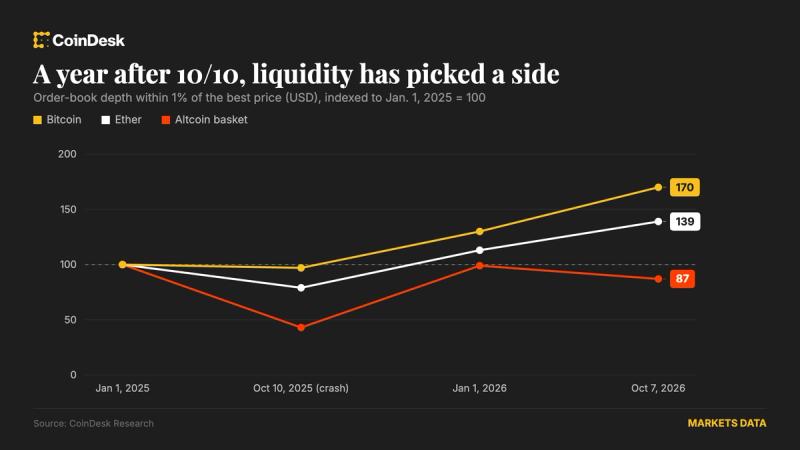
One year after 10/10, bitcoin and ether liquidity have rebuilt, but other altcoins still face risks
Bitcoin and ether order books are deeper than before the crash, while altcoin liquidity keeps eroding and spot trading remains wel...

ETH fee burns cover just 2% of new coins printed in 2026
Ethereum's transaction fees have burned enough ETH to offset just 2.07% of the new coins issued in 2026, according to an Oct. 9 su...

Being right about Bitcoin won’t save your 3x leveraged ETF position
Bitcoin's next recovery could vindicate your investment thesis but leave your leveraged fund deep in the red, because the fund's d...

Ethereum leads stablecoin market cap growth, adding $243M in a week
Ethereum's stablecoin growth highlights potential concentration risks and market consolidation, impacting DeFi liquidity and stabi...

Luxor’s reported 6–13% annualized Bitcoin yield depends on mining delivery
Luxor, a Bitcoin mining derivatives provider, reported a 6–13% annualized Bitcoin financing spread in its September lookback, publ...