XRP April Target Of $8 To $13 ‘Still Stands,’ Says Crypto Analyst
Crypto analyst CasiTrades (@CasiTrades) published a new XRP analysis, highlighting yesterday’s intraday plunge to about $1.61 after the widely watched $1.90 level gave way. “Overnight we saw $1.90 break down, and price f...
Archive context
Older archive item. Useful for background and entity history, but not a fresh market-moving signal.

Crypto analyst CasiTrades (@CasiTrades) published a new XRP analysis, highlighting yesterday’s intraday plunge to about $1.61 after the widely watched $1.90 level gave way. “Overnight we saw $1.90 break down, and price flushed to around $1.61,” the analyst commented via X, pointing out that this sudden drop produced “new extremes on the RSI across the market” and came within striking distance of a previously identified support zone.
XRP To Hit $13 In April?Since the crash on Monday, XRP has rebounded significantly, but the analyst now views $1.90 as “major resistance at this point” and underscores that the breakdown of the 0.5 Fibonacci retracement near $1.90, while disappointing for bulls, may still be consistent with a larger corrective scenario.
The chart itself reveals an ongoing corrective Wave 2, as CasiTrades maintains: “I’ve believed for a while we were in a macro Wave 2.” He emphasizes that the breach of the $1.90 support level confirms that corrective pattern “more than it invalidates anything.” Below $1.90, the next crucial pivot, according to the chart, is the “golden .618 retracement,” flagged at about $1.55.
This area is part of a broader green support band that stretches from approximately $1.45 (the .65 retracement) up toward $1.55 (the .618 retracement). CasiTrades suggests that the price action arriving in this zone might well be the turning point that sets XRP on a path to higher ground. “It’s exactly what sets up the kind of Wave 3 that breaks through ATHs,” she said, while also noting, “The next wave should easily break those resistances. Be prepared for this to happen very fast.”
The relative strength index on CasiTrades’ chart shows XRP reaching extreme oversold territory amid yesterday’s crash, having dropped below 20 before recovering to the low 40s. That bounce, which aligned with price returning from $1.61 toward the $1.90 region, underscores the significance of the short-term retracement.
Yet the analyst maintains that any definitive bullish confirmation now hinges on whether XRP can stabilize around $1.55 if it continues to slide. “If we do bottom near $1.55, it actually strengthens the bullish case for those big April targets—$8 to $13 still stands,” CasiTrades wrote, reiterating her belief that a successful Wave 3 extension above prior highs could generate a rapid climb into the multi-dollar range.
Resistance at $1.90 remains front and center for traders in the immediate term, with CasiTrades remarking that “$1.90 – resistance test – happening now.” She believes that if price fails to hold above that threshold on any retest, XRP will likely continue its descent toward the $1.55 mark.
From there, the chart suggests a potential wave reversal that, if confirmed, could deliver one of the more important breakouts of this cycle. “I still believe this could be one of the most important months XRP prints this cycle,” CasiTrades added, underscoring the high stakes surrounding the 0.618 Fib level bear $1.55 and the possibility of a new bullish impulse forming in the near future.
Whether XRP can regroup and power through the $1.90 ceiling after dipping to the golden pocket remains the central question. At press time, XRP traded at $1.86.
Why this matters
This altcoin story adds another data point to the current market tape and is useful when read alongside nearby source coverage.
Original source
Read on NewsBTCRelated market context

Why Is XRP Down Today? Bears Target $1.30 Support as Selling Pressure Builds
The downturn has weakened XRP’s short-term technical structure, leaving traders focused on whether buyers can defend nearby suppor...
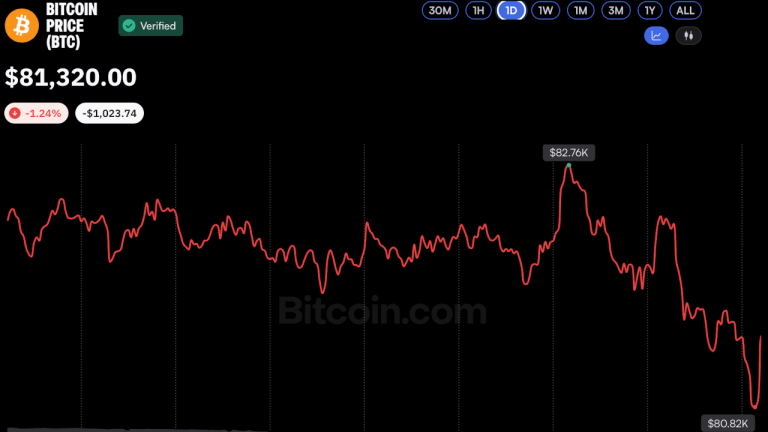
Bitcoin Price Hovers Near $81K as Analysts See Potential Market Bottom
Bitcoin slipped below $81,000 on Oct. 16 amid heightened market volatility, but analysts remained cautiously optimistic, suggestin...

Ethereum Price Prediction: ETH Outpaces the Market as Crypto Rebounds
Ethereum is outperforming the crypto market, rising by almost 3% over the past 24 hours to just a notch under $2,500 as digital as...

Bitcoin Price Prediction: Bitcoin Tracks Treasury Real Rates, Fidelity Finds
Bitcoin is trading at $82,000, rebounding from $80,000 since yesterday morning, as traders weigh a new macro signal that could fli...

Bitcoin Price Prediction: Can BTC Rebound After a Brutal Sell-off?
Bitcoin is trading at $81,100, down 2.5% over 24 hours. The larger move has been rougher as it briefly slid toward $80,000 as soon...

Why Is Crypto Down? Hotter CPI Fuels Fears of Delayed Fed Rate Cuts
Why is crypto down? Bitcoin fell by 4% over 24 hours, while Ethereum lost about 6.5% as hotter U.S. inflation and a technology sel...