XRP Breaks Out Across The Board—But One Thing’s Missing
XRP has slipped the leash that has restrained it since the mid-January peak at $3.40, with the latest weekly candle closing a fraction above the descending trend-line that has defined the upper boundary of its six month...
Archive context
Older archive item. Useful for background and entity history, but not a fresh market-moving signal.

XRP has slipped the leash that has restrained it since the mid-January peak at $3.40, with the latest weekly candle closing a fraction above the descending trend-line that has defined the upper boundary of its six month trendline. At press time the token is quoting $2.22 on major spot venues, having tagged an intraday high of $2.31 a few hours after the weekly open.
XRP Flashes Triple BreakoutThe technical alignment behind today’s move is unusually tight. The price itself has edged through trend-line resistance traced from the 16 January swing high, but the same behaviour is evident beneath the surface.
On the momentum pane the weekly relative-strength index, muted since late March, has poked above its own falling resistance line at 54, ending a sequence of lower RSI highs that mirrored each failed rally in price. A similar story is unfolding on the WaveTrend Oscillator: the fast and slow signal lines have curled upward and printed a tentative positive cross just below the zero-line.
Taken together, the trifecta—price above pennant roof, RSI above trend-line, WTO signals turning—constitutes what technicians refer to as confluence: three independent tools broadcasting the same directional bias on the same timeframe. The only missing ingredient is conviction in volume. Seasoned chart-watchers will want to see that metric expand in the coming sessions to validate the move.
Independent analyst Maelius (@MaeliusCrypto), who posted the chart that first drew the community’s attention, summed up the state of play in a single line: “XRP teasing us with a breakout! Asking for volume to follow!” The plea is well-placed. Trendline resolutions that lack a parallel surge in activity are prone to fail-back tests; a decisive influx of bids is required to flip the freshly conquered trend-line into reliable support.
Support for the bullish case is also visible on slower-moving gauges. The 50-week exponential moving average now rises through $1.84, its steepest positive slope in more than two years, and the current candle sits comfortably above that long-term trend proxy.
Should the breakout hold and attract the liquidity Maelius is watching for, classical chart theory projects an initial objective near the midpoint of January’s supply shelf around $3.00. A weekly close back beneath the trend-line, by contrast, would neutralise the pattern and expose the high-volume node at the demand zone near $2.0 and the $1.84 price tag if bears regain momentum.
For now the market is balanced on the knife-edge between promise and proof. Price, RSI and WTO have all stepped over their respective fault lines; only the tape itself remains to confirm that traders are prepared to follow through. Whether this triple breakout marks the beginning of XRP’s next leg higher—or merely another feint within a larger consolidation—will be determined in the sessions ahead.
At press time, XRP traded at $2.21.
Why this matters
This altcoin story adds another data point to the current market tape and is useful when read alongside nearby source coverage.
Original source
Read on NewsBTCRelated market context

Why Is XRP Down Today? Bears Target $1.30 Support as Selling Pressure Builds
The downturn has weakened XRP’s short-term technical structure, leaving traders focused on whether buyers can defend nearby suppor...
Bitcoin Holds Above $81,000 as Producer Prices Post Largest Jump Since 2022
Wholesale prices rose 1.3% in September, with energy accounting for more than 80% of the increase. Bitcoin rose less than half a p...

Most net-long XRP positions sit above the current price, leaving traders underwater
High long exposure and potential liquidations could exacerbate XRP's price volatility, impacting market stability and trader confi...
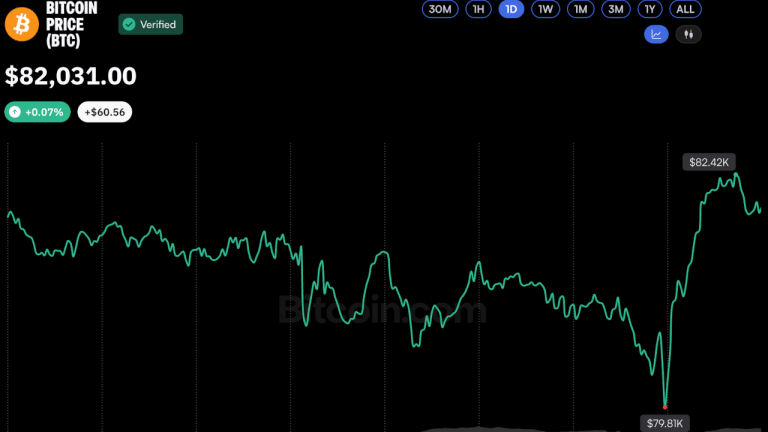
Bitcoin Price Rebounds Above $82K After Brief Dip Below $80K
Bitcoin staged a rapid recovery Thursday, climbing back above $82,000 to trade slightly higher over 24 hours with a market cap nea...

Bitcoin ETF Records $260 Million Outflows, Led by Fidelity and BlackRock
US spot Bitcoin ETFs recorded $261.4 million in net outflows on October 14, led by Fidelity’s FBTC with $152.7 million withdrawn a...

Microsoft Copilot AI Predicts Unbelievable Chainlink (LINK) Price
Listen up: if you’re a member of Sergey Nazarov’s Chainlink army, Microsoft Copilot AI predicts that by January 1, 2027, LINK coul...