XRP Coils For A Breakout, But Key Resistance Still Stalls The Rally
XRP remains in a holding pattern, according to the latest chart analysis shared by crypto analyst @CasiTrades. Despite a relatively subdued weekend, XRP continues to trade above critical support levels, indicating that t...
Archive context
Older archive item. Useful for background and entity history, but not a fresh market-moving signal.

XRP remains in a holding pattern, according to the latest chart analysis shared by crypto analyst @CasiTrades. Despite a relatively subdued weekend, XRP continues to trade above critical support levels, indicating that the current bullish structure has not been invalidated.
XRP Price Remains BullishA closer look at the 4-hour XRP/USD chart by @CasiTrades shows two converging trend lines that have formed a symmetrical triangle spanning from mid-January to mid-March. XRP’s price action has respected both the upper and lower boundaries of this formation until early March.
Back then, the XRP price initially staged a breakout attempt, but it turned out to be a fakeout and quickly failed. However, the second breakout now appears more promising. Following the move above the trendline, XRP is currently undergoing a bullish retest and has successfully bounced off the breakout level. If this retest holds in the coming days, it could signal that the bulls are gaining control and have won this critical battle for momentum.
Fibonacci retracement levels stand out as key guides for potential continuation or reversal. The 0.382 retracement near $2.26 has clearly acted as a critical support, while the 0.236 level near $2.70 aligns with a horizontal zone that functioned as prior support in early February before flipping to short-term resistance.
“XRP Holding Strong, But Still in Waiting Mode! It’s been a quiet weekend for XRP, but the bullish structure remains intact. We’re still holding above $2.26, the key .382 retracement support, and price has spent some time flipping the consolidation to support—markets are setting up for the next move!” Casi notes.
A step higher on the chart sits the 0.118 retracement near $3.05, which lies just under a horizontal band that previously capped price action in late January. These thresholds combine to create a layered resistance region between $2.70 and $3.05, an area XRP would need to overcome for a credible shift in market sentiment.
Signs of strength would become more conclusive if XRP could break above $3.40, a threshold that @CasiTrades emphasizes as necessary to confirm a broader trend change. The analyst highlights $3.40 as a defining technical barrier that must be cleared before traders can speak of a “new trend,” possibly corresponding to wave 3 of a larger market cycle. The chart also shows a projected line pushing toward $3.80, which suggests that any breakout above $3.40 could be substantial, although the analyst maintains that confirmation must precede any speculation about reaching higher price targets.
On the downside, the chart indicates that if the 0.382 Fibonacci at roughly $2.26 should fail, support at $1.90 (the 0.5 retracement) would be the next logical safety net for buyers. Even lower levels near $1.54 represent the origin of the latest upward swing and could attract significant demand if the market were to experience an extended sell-off. RSI readings on the 4-hour timeframe hover in the mid-50 range, pointing to a market that is neither overbought nor oversold. This neutral momentum further underscores the “waiting mode” described by @CasiTrades, in which participants appear cautious about placing aggressive bets ahead of a decisive breakout or breakdown.
In commentary shared via X, the analyst concludes: “XRP needs to break above $3.40 to confirm our new trend, but until then we are waiting signs of confirmation, which may not be obvious until wave 3 in the market cycle. Key Fib levels have already been reached. The market is on the edge of a breakout, and this week could be a defining moment!”
At press time, XRP traded at $2.29.
Why this matters
This altcoin story adds another data point to the current market tape and is useful when read alongside nearby source coverage.
Original source
Read on NewsBTCRelated market context

XRP Price Prediction: XRP Duo Turn Bullish, $1,000 Dream Lives On
XRP is trading at $1.34, up more than 1% after a brutal Wednesday. Ripple CEO Brad Garlinghouse says XRP has legal clarity despite...
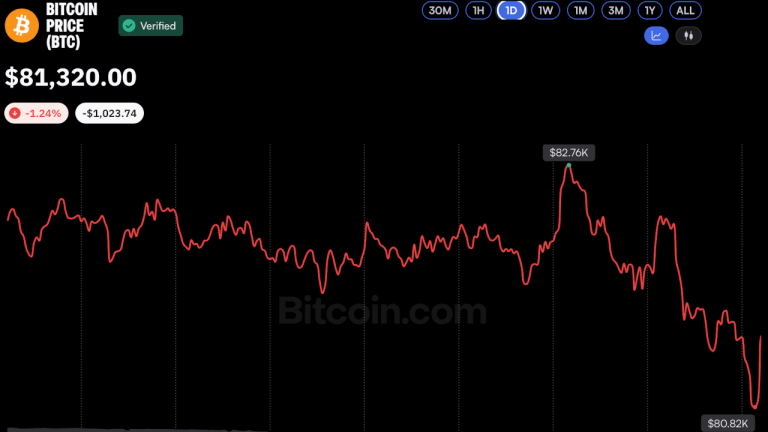
Bitcoin Price Hovers Near $81K as Analysts See Potential Market Bottom
Bitcoin slipped below $81,000 on Oct. 16 amid heightened market volatility, but analysts remained cautiously optimistic, suggestin...

Bitcoin Price Prediction: Bitcoin Tracks Treasury Real Rates, Fidelity Finds
Bitcoin is trading at $82,000, rebounding from $80,000 since yesterday morning, as traders weigh a new macro signal that could fli...

Ethereum Price Prediction: ETH Outpaces the Market as Crypto Rebounds
Ethereum is outperforming the crypto market, rising by almost 3% over the past 24 hours to just a notch under $2,500 as digital as...

Deutsche Bank Nears Bitcoin Custody Launch As Crypto Push Expands Beyond Europe
TL;DR: Deutsche Bank is preparing to introduce institutional digital asset custody services, initially targeting professional clie...

Claude AI Predicts that Chainlink (LINK) Could Hit Triple Digits in 2026
Claude AI predicts a wildly bullish price target for Chainlink (LINK), claiming it could reach $100 by January 1, 2027, if a near-...