XRP Could Hit $0.39 Before Soaring 1000%: Crypto Analyst
The price of XRP is currently navigating bearish territory. Following its descent below the 200-day exponential moving average (EMA), the digital currency has further dipped beneath the critical 0.618 Fibonacci retraceme...
Archive context
Older archive item. Useful for background and entity history, but not a fresh market-moving signal.

The price of XRP is currently navigating bearish territory. Following its descent below the 200-day exponential moving average (EMA), the digital currency has further dipped beneath the critical 0.618 Fibonacci retracement level. Despite this downward trend, renowned crypto analyst Dark Defender offers a glimmer of optimism for the XRP army.
However, he also suggests that the market might face additional challenges first before embarking on a remarkable 1000% surge. In his latest analysis, the crypto analyst shared the weekly XRP/USD chart, employing a range of technical indicators including the Ichimoku Cloud, Fibonacci levels, ABC corrective patterns, and Elliott Wave theory.
XRP Price Could Drop FurtherThe chart provided depicts XRP’s price movements within the context of an Elliott Wave structure, which postulates that markets move in predictable, repetitive cycles. The analyst is identifying the progress of an ABC correction pattern within a larger Elliott Wave cycle. This correction consists of three waves: A (down), B (up), and C (down again), which is purportedly nearing completion.
Dark Defender’s analysis suggests that the current market structure for XRP mirrors that of a period in early 2021 when the crypto asset surged by 1,060% in less than four months. According to Dark Defender, this is indicated by the confluence of the RSI readings and price action.
The RSI, a momentum oscillator that measures the extent of recent price changes to evaluate overbought or oversold conditions, is marked with a white circle at a level of approximately 47.61, indicating neutrality. This is similar to the RSI level noted in 2021, suggesting a potential repetition in market sentiment and behavior. Moreover, the RSI is currently in an uptrend, as previously stated, with plenty of room to the upside.
The Ichimoku Cloud, a collection of indicators that show support and resistance levels, as well as momentum and trend direction, shows that XRP is trading within the cloud on the weekly timeframe. A breakout from the cloud could signal a strong trend in the direction of the breakout.
Fibonacci levels, derived from the Fibonacci sequence, are used to predict the extent of a correction or a continuation of a trend. The chart highlights several key Fibonacci retracement levels from a recent high to a low. These levels are $0.3917 (23.60%), $0.4623 (38.20%), $0.5286 (50.00%), and $0.6649 (70.20%).
According to the analysis, holding above or below the 50% retracement level at $0.5286 could indicate the likelihood of testing the next levels at $0.6649 or falling towards $0.3917, respectively. “#Equation: 1. XRP stays below $0.52 for 3 days —>$0.39 in play 2. XRP stays above $0.52 for 3 days—> $0.66 in play,” the analyst remarked.
Followed By 1000% Price RallyLooking further ahead, the Fibonacci extension level at 161.80%, which translates to a price target of $1.8815, is highlighted as potential objectives for Wave 3 of the Elliott Wave cycle. The analyst has outlined a substantial potential increase, with a range up to $5.85, which would exceed the 161.80% Fibonacci extension level.
However, it’s important for traders to note the main resistance trend line that has been pressing down on the price (red line), as well as the support trend line that has been upholding the price during retracements (blue line) are the most crucial price levels at the moment. The convergence of these trend lines forms a triangle that is a focal point for the price action going forward. A decisive break in either direction could lead to significant price moves – either to $0.39 or $0.66 in the short-term.
In conclusion, Dark Defender’s analysis presents two pivotal scenarios, both leading to the anticipation of a major wave up (Wave 3) after the completion of the current corrective phase. “One way or another, wave 2 will be completed & wave 3 is expected to target $1.88 – $5.85 for both scenarios,” Dark Defender concludes.
At press time, XRP traded at $0.53195.
Why this matters
This altcoin story adds another data point to the current market tape and is useful when read alongside nearby source coverage.
Original source
Read on NewsBTCRelated market context

Why Is XRP Down Today? Bears Target $1.30 Support as Selling Pressure Builds
The downturn has weakened XRP’s short-term technical structure, leaving traders focused on whether buyers can defend nearby suppor...
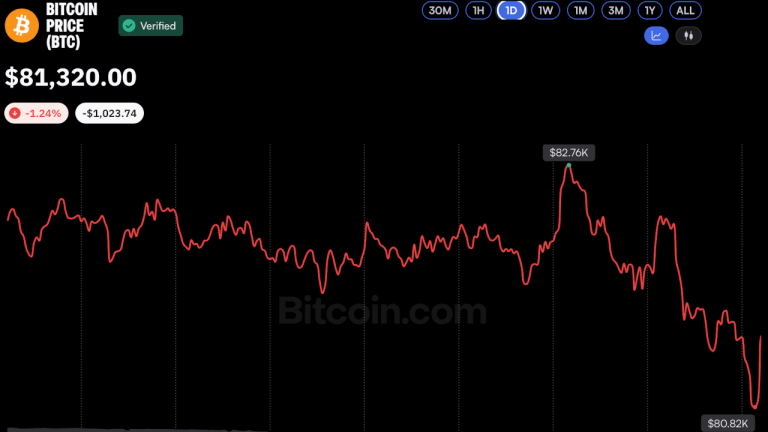
Bitcoin Price Hovers Near $81K as Analysts See Potential Market Bottom
Bitcoin slipped below $81,000 on Oct. 16 amid heightened market volatility, but analysts remained cautiously optimistic, suggestin...

XRP Price Faces a Turning Point as ETFs Record 13 Weeks of Inflows
XRP ETFs have already attracted $8 million in net inflows this week, extending their positive streak to 13 weeks, while Bitcoin, E...

XRP Price Could Surge 145% as 2023 Rally Pattern Returns
XRP price traded near $1.34 on October 16, about 4% below the 200-day simple moving average (SMA) at $1.36. The immediate test is...

Crypto Analyst Lark Davis: The Bitcoin Bull Run has Begun
Bitcoin Magazine Crypto Analyst Lark Davis: The Bitcoin Bull Run has Begun Bitcoin has been trading sideways in the $80Ks, but Lar...

Ethereum Price Prediction: ETH Outpaces the Market as Crypto Rebounds
Ethereum is outperforming the crypto market, rising by almost 3% over the past 24 hours to just a notch under $2,500 as digital as...