XRP Eyes $8.30 Target As Rare Chart Pattern Emerges From Prolonged Decline
A drop to 83 cents could be the setup XRP investors have been waiting for. Crypto analyst Egrag Crypto has identified a falling wedge structure in XRP’s price chart that spans nearly nine months, with the token trading a...
Archive context
Older archive item. Useful for background and entity history, but not a fresh market-moving signal.

A drop to 83 cents could be the setup XRP investors have been waiting for.
Crypto analyst Egrag Crypto has identified a falling wedge structure in XRP’s price chart that spans nearly nine months, with the token trading around $1.30 after a prolonged slide.
Based on the analysis, XRP may fall further before any significant recovery — but that bottom could mark the start of a sharp move higher, potentially reaching $8.30.
Six Painful MonthsXRP has now posted six straight months of losses, its worst such run since 2014. April is already trending negative, down 1.80% in the first days of the month. If it closes in the red, it would be the seventh consecutive monthly loss — a first in the token’s history.
The token peaked at $3.60 in July 2025. Since then, the price has been compressed between two downward-sloping lines — a resistance ceiling above and a support floor below. Each time the price has hit either line, it has reversed course. That back-and-forth movement is what defines the wedge pattern.
#XRP – The RED Chart :
It’s red… but it’s offering one of the best buying opportunities and upside potential for #XRP.
Closing above $1.80 = invalidation of the falling wedge Cross of the 2 red lines is coming = Bearish
Otherwise: Bottom target: crystal clear →… pic.twitter.com/TcXESiXvzK
— EGRAG CRYPTO (@egragcrypto) April 3, 2026
Two Key Price Levels Are Driving The OutlookEgrag’s chart shows XRP may first push up to $1.80, where the upper resistance line sits. Reports indicate that level has rejected previous recovery attempts, most recently in early January 2026 when the price hit $2.41 and pulled back sharply. A similar rejection at $1.80 would send the price downward again.
From there, the projected path leads to approximately 83 cents — the point where the wedge’s lower support line meets a long-term upward trendline the analyst calls the Atlas Line.
That level is described as the major floor for the current structure. Data from the chart shows XRP could then bounce back above $1.00, dip once more to around 91 cents to retest support, and then begin a larger move upward.
If that sequence plays out, the breakout target lands at $8.30.
The wedge has already absorbed several significant price swings. During a market selloff on October 10, 2025, XRP fell from $2.80 down to $1.36, touching the lower trendline. The price bounced from that level. In early February 2026, another drop brought the token to $1.11 before support held again.
Breakout Conditions Depend On Two Clear BoundariesThe bullish case has limits. According to Egrag’s analysis, a close above $1.80 on the upper resistance line would break the wedge pattern and cancel the current setup entirely.
On the downside, a drop below the 83-to-91-cent support zone would point to deeper weakness and raise the possibility of further decline beyond what the chart currently projects.
Featured image from Pexels, chart from TradingView
Why this matters
XRP is a tracked market entity in the DigitalMoneyBox archive, making this useful context for readers monitoring repeated mentions and follow-up coverage.
Original source
Read on NewsBTCRelated market context

Ethereum Price Prediction: 5% Weekly Drops as Bitmine Plans to Stop ETH Buying
Ethereum latest selloff has put a key support zone and price prediction under pressure. ETH falls to $2,500 after 5% weekly declin...

Bitcoin (BTC) Price Today: $81.1K Becomes Critical as Traders Eye Double-Bottom Setup
Bitcoin recently climbed above $85,000 before encountering renewed selling pressure. Glassnode’s latest Week On-Chain report shows...

Securitize Rolls Out 1:1-Backed Tokens of Apple, Nvidia and 10 Other U.S. Stocks on Solana
Securitize launched Securitize Stocks on Thursday, a line of tokenized U.S. equities for eligible investors in the U.S., the Europ...
Citi predicts Bitcoin going back to $113,000. Here’s what the buying data shows
Citi's $113,000 Bitcoin target would require a roughly 36% rise from the Oct. 7 reference price, keeping it below its previous rec...

UK sanctions crypto platforms suspected of supporting Russian financial networks
The UK sanctioned Cryptomus, Heleket and TokenSpot in a Russia sanctions package, with TRM Labs identifying links to Grinex and Ga...
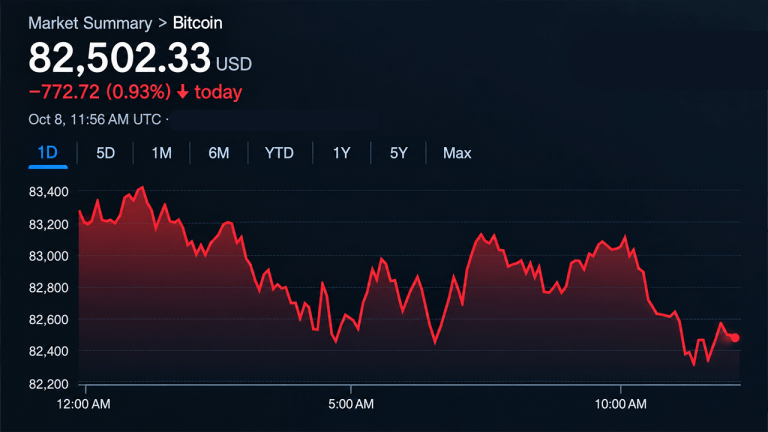
Bitcoin Price Holds Above $82K Despite Mounting Bearish Pressure
Bitcoin’s price is struggling to find its footing on Oct. 8, 2026, after a sharp selloff knocked prices from the mid-$85,000s into...