XRP Faces Make-Or-Break Moment Amid Bearish Threat
XRP is hovering around $2.52 on the daily chart, maintaining a delicate balance between bullish momentum and the potential for a major reversal pattern. Renowned crypto analyst Josh Olszewicz (known on X as @CarpeNoctom)...
Archive context
Older archive item. Useful for background and entity history, but not a fresh market-moving signal.

XRP is hovering around $2.52 on the daily chart, maintaining a delicate balance between bullish momentum and the potential for a major reversal pattern. Renowned crypto analyst Josh Olszewicz (known on X as @CarpeNoctom) shared a detailed Ichimoku-based chart, highlighting a possible Head and Shoulders formation. According to Olszewicz, a sustained break above $2.85 would likely invalidate bearish concerns tied to this classic reversal setup.
Can XRP Bust Through $2.85?XRP’s most recent rally took shape in mid-October 2024, when it traded near $0.48 before rising sharply toward $3.3999 in early 2025. This rally unfolded quickly, hinting at robust buying pressure and a strong bullish sentiment through the end of 2024. However, after hitting that local peak of roughly $3.40, XRP has pulled back toward the $2.50 area, creating a pivot region that now defines the immediate trend direction.
On Olszewicz’s chart, which employs Ichimoku settings of (20, 60, 120, 30), the price hovers near the Conversion Line (Tenkan-Sen) around $2.4750 while the Base Line (Kijun-Sen) sits closer to $2.5749. The Ichimoku Cloud itself projects forward, with Senkou Span A around $2.57 and Senkou Span B near $1.94, forming a green band that suggests broader bullish support as long as price stays above the Cloud. The chart shows that XRP has so far managed to remain above most Ichimoku levels, reflecting ongoing positive momentum despite recent volatility.
Within this framework, the Head and Shoulders formation looms as a potential signal of a bearish reversal. The formation appears to be anchored by a head near $3.3999, with potential “shoulders” close to the $2.85 and $2.90 zone. According to Olszewicz, a move above $2.85 should help negate the likelihood of a bearish breakdown, while sustained rejection below that level keeps the Head and Shoulders possibility firmly in play. Market participants will also be watching the $2.0 region, often interpreted as the neckline zone for this formation, because a decisive drop beneath it may confirm the reversal pattern.
Additional price regions highlighted by the chart add clarity to the bullish-bearish tug-of-war. The Kijun-Sen around $2.5749 serves as an important medium-term pivot, frequently acting as both support and resistance in Ichimoku analysis. Meanwhile, the bottom of the Ichimoku Cloud near $1.94 stands as a last line of defence for bulls, should any deeper pullback occur.
Ultimately, the broader sentiment hinges on whether XRP can break above the $2.85 threshold and thereby nullify the threat of this Head and Shoulders formation. If the market reclaims levels above that price zone, it would suggest bullish momentum remains intact. Conversely, failure to overcome $2.85, combined with a drop below $2.0, could point to a deeper reversal and invite further selling pressure.
At press time, XRP traded at $2.60.
Why this matters
This altcoin story adds another data point to the current market tape and is useful when read alongside nearby source coverage.
Original source
Read on NewsBTCRelated market context

XRP Price Prediction: XRP Duo Turn Bullish, $1,000 Dream Lives On
XRP is trading at $1.34, up more than 1% after a brutal Wednesday. Ripple CEO Brad Garlinghouse says XRP has legal clarity despite...

Hot Inflation Data Puts Bitcoin Under Pressure, but ‘Difficult’ Isn’t ‘Bearish’: CoinShares
Bitcoin Magazine Hot Inflation Data Puts Bitcoin Under Pressure, but ‘Difficult’ Isn’t ‘Bearish’: CoinShares Bitcoin’s price has d...

Google Gemini AI Predicts Bitcoin to Hit $175K by 2027
When prompted, Google Gemini AI predicts that by January 1, 2027, Bitcoin could be trading for $175,000. It gives a hypothetical c...
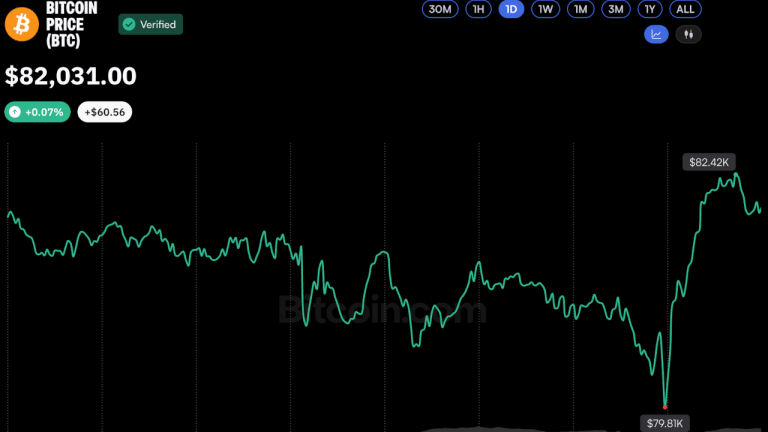
Bitcoin Price Rebounds Above $82K After Brief Dip Below $80K
Bitcoin staged a rapid recovery Thursday, climbing back above $82,000 to trade slightly higher over 24 hours with a market cap nea...

Bitcoin Reclaims $82,000 as VIX Jumps 22% and Nasdaq Slides Ahead of Black Monday Anniversary
Bitcoin recovered above $82,000 as the VIX surged 22% and the Nasdaq fell 2.15% ahead of the Black Monday anniversary, with ETF ou...

Ethereum Price Prediction: ETH Outpaces the Market as Crypto Rebounds
Ethereum is outperforming the crypto market, rising by almost 3% over the past 24 hours to just a notch under $2,500 as digital as...