XRP Price Dips Below Support – Is A Bearish Breakdown Now Underway?
XRP price started a fresh decline below $2.920. The price is now consolidating losses and might continue to move down if it trades below $2.850. XRP price is slowly moving lower below the $2.920 pivot zone. The price is...
Archive context
Older archive item. Useful for background and entity history, but not a fresh market-moving signal.

XRP price started a fresh decline below $2.920. The price is now consolidating losses and might continue to move down if it trades below $2.850.
- XRP price is slowly moving lower below the $2.920 pivot zone.
- The price is now trading below $2.950 and the 100-hourly Simple Moving Average.
- There was a break below a key declining channel with support at $2.90 on the hourly chart of the XRP/USD pair (data source from Kraken).
- The pair could start a fresh decline if it settles below $2.850.
XRP price failed to stay above $3.020 and started a fresh decline, like Bitcoin and Ethereum. The price declined below $3.00 and $2.950 to enter a short-term bearish zone.
Besides, there was a break below a key declining channel with support at $2.90 on the hourly chart of the XRP/USD pair. The price tested the $2.850 zone and is currently consolidating losses below the 23.6% Fib retracement level of the downward move from the $3.049 swing high to the $2.850 swing low.
The price is now trading below $2.920 and the 100-hourly Simple Moving Average. If there is a fresh upward move, the price might face resistance near the $2.90 level. The first major resistance is near the $2.950 level and the 50% Fib retracement level of the downward move from the $3.049 swing high to the $2.850 swing low.
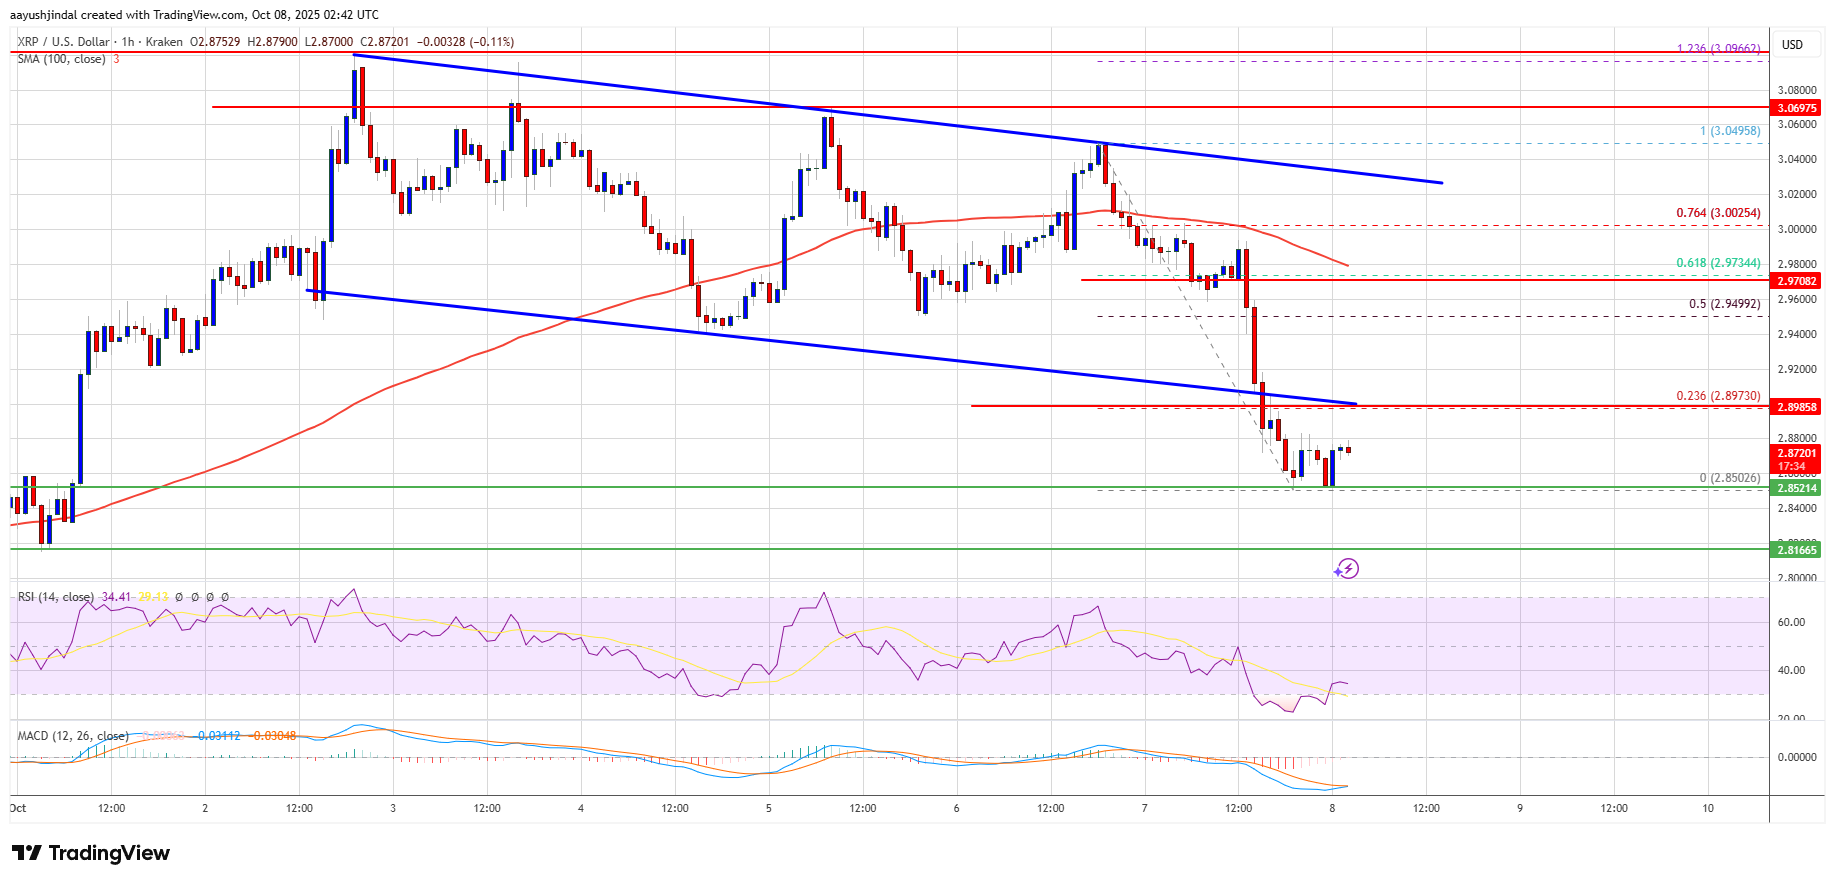
A clear move above the $2.950 resistance might send the price toward the $3.00 resistance. Any more gains might send the price toward the $3.020 resistance. The next major hurdle for the bulls might be near $3.050.
Another Decline?If XRP fails to clear the $3.00 resistance zone, it could start a fresh decline. Initial support on the downside is near the $2.850 level. The next major support is near the $2.80 level.
If there is a downside break and a close below the $2.80 level, the price might continue to decline toward $2.7250. The next major support sits near the $2.650 zone, below which the price could continue lower toward $2.60.
Technical Indicators
Hourly MACD – The MACD for XRP/USD is now gaining pace in the bearish zone.
Hourly RSI (Relative Strength Index) – The RSI for XRP/USD is now below the 50 level.
Major Support Levels – $2.850 and $2.80.
Major Resistance Levels – $2.90 and $2.920.
Why this matters
This altcoin story adds another data point to the current market tape and is useful when read alongside nearby source coverage.
Original source
Read on NewsBTCRelated market context

XRP Price Prediction: Elliott Wave Setup Points to $3 as XRP Nears a Potential $2 Breakout
XRP Price Prediction: Elliott Wave Setup Points to $3 as XRP Nears a Potential $2 Breakout XRP is approaching a critical technical...

Meta AI Predicts This Huge Catalyst Could Lead to $40 XRP
Mark Zuckerberg’s Meta AI predicts an insanely wild bullish price target for XRP by January 1, 2027. The AI bot believes $25–$40 i...

Bitcoin’s weekend rebound faces an $80,400 test after nearly $730 million in ETF outflows
Bitcoin traded near $82,900 in PerpFinder’s Oct. 10, 09:36 UTC snapshot, with traders watching whether the weekend rebound brings...

Ledger hack scare nears $90 million as Tether moves to freeze stolen USDT
Suspected Ledger wallet thefts are approaching $90 million as Tether freezes USDT stablecoin linked to the incident, according to...

XRP rebounded as Binance spot turnover fell nearly 80%
XRP futures exposure began rebuilding by October 11 after market-data provider XRPL.to recorded $40.70 million in long liquidation...

Aave’s USDG rollover plan has a yield below most quoted borrowing rates
Aave’s proposed USDG rollover would let borrowers carry their stablecoin debt into a new fixed-yield USDG position, but the replac...