XRP Price Locked in Range-Bound Trading: Can It Escape Soon?
XRP price is attempting a recovery wave above the $0.5500 level. The price might struggle to clear the range resistance at $0.5720 and $0.5800. XRP price started a decent increase from the $0.5330 zone. The price is now...
Archive context
Older archive item. Useful for background and entity history, but not a fresh market-moving signal.

XRP price is attempting a recovery wave above the $0.5500 level. The price might struggle to clear the range resistance at $0.5720 and $0.5800.
- XRP price started a decent increase from the $0.5330 zone.
- The price is now trading below $0.5650 and the 100-hourly Simple Moving Average.
- There is a key bullish trend line forming with support at $0.5520 on the hourly chart of the XRP/USD pair (data source from Kraken).
- The pair could decline again if it fails to stay above $0.5520 and $0.5500.
XRP price extended losses below $0.540 like Bitcoin and Ethereum. The price tested the $0.5330 zone and recently started a recovery wave. There was a move above the $0.5420 and $0.5440 resistance levels.
The price was able to clear the 50% Fib retracement level of the downward move from the $0.5720 swing high to the $0.5333 low. There was a move above the $0.5550 level. However, the bears seem to be active near the $0.5625 and $0.5640 levels.
The price is now trading below $0.5650 and the 100-hourly Simple Moving Average. Besides, there is also a key bullish trend line forming with support at $0.5520 on the hourly chart of the XRP/USD pair.
On the upside, the price might face resistance near the $0.5625 level or the 76.4% Fib retracement level of the downward move from the $0.5720 swing high to the $0.5333 low. The first major resistance is near the $0.5650 level.
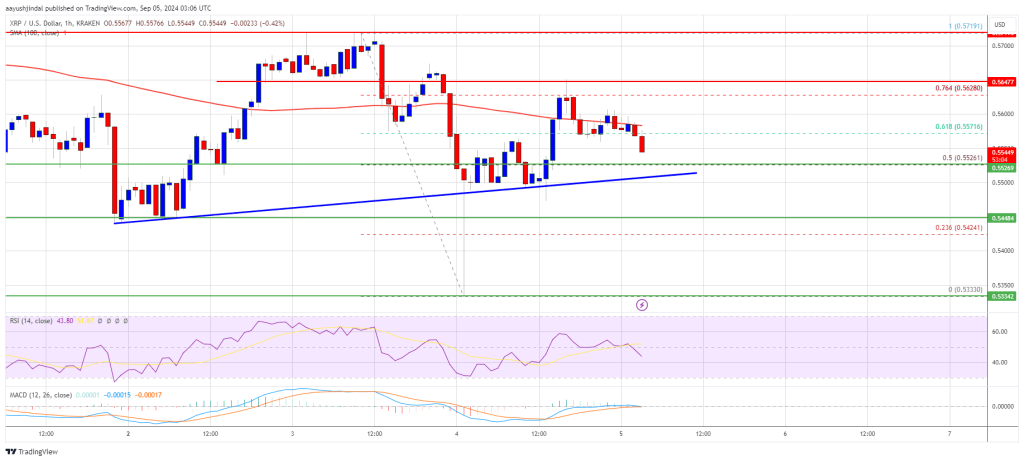
The next key resistance could be $0.5720. A clear move above the $0.5720 resistance might send the price toward the $0.5850 resistance. The next major resistance is near the $0.5880 level. Any more gains might send the price toward the $0.600 resistance or even $0.6060 in the near term.
Another Decline?If XRP fails to clear the $0.5625 resistance zone, it could start another decline. Initial support on the downside is near the $0.5525 level and the trend line. The next major support is $0.5500.
If there is a downside break and a close below the $0.5550 level, the price might continue to decline toward the $0.540 support in the near term. The next major support sits at $0.5320.
Technical Indicators
Hourly MACD – The MACD for XRP/USD is now losing pace in the bullish zone.
Hourly RSI (Relative Strength Index) – The RSI for XRP/USD is now below the 50 level.
Major Support Levels – $0.5525 and $0.5400.
Major Resistance Levels – $0.5625 and $0.5720.
Why this matters
This altcoin story adds another data point to the current market tape and is useful when read alongside nearby source coverage.
Original source
Read on NewsBTCRelated market context

Bitcoin (BTC) Price Prediction: Glassnode Signals Potential Price Floor Near $80K as Sellers Capitulate
Similar spikes in Bitcoin’s realized losses preceded local price bottoms in August and September, raising the possibility that the...

USDC Network Fees in 2026: Ethereum vs Solana vs Other Chains, Priced to the Cent
A USDC balance is the same dollar on every chain Circle issues it on. Moving it is not the same price. In October 2026 the spread...

Bitcoin Price Forecast: $81,500 Leaves Weekly Close Needing a Big Push
Sunday’s (October 18) Bitcoin price forecast puts it near $ 81,600, with technical indicators sending mixed signals. Shorter-term...

ChatGPT AI Predicts Million-Dollar Bitcoin by 2027
ChatGPT AI predicts Bitcoin will hit $1M+, which isn’t a crazy call, since many analysts share the same view. What makes this pred...

Deutsche Bank Nears Bitcoin Custody Launch As Crypto Push Expands Beyond Europe
TL;DR: Deutsche Bank is preparing to introduce institutional digital asset custody services, initially targeting professional clie...

XRP Price Could Surge 145% as 2023 Rally Pattern Returns
XRP price traded near $1.34 on October 16, about 4% below the 200-day simple moving average (SMA) at $1.36. The immediate test is...