XRP Price Mirrors 2017 Sideways Accumulation Trend – Here’s What Happened Last Time
XRP’s recent price action in 2025 was more of a dynamic movement than a simple sideways drift. After rallying strongly earlier in 2025 and pushing to new all-time highs, the cryptocurrency has spent much of the recent mo...
Archive context
Older archive item. Useful for background and entity history, but not a fresh market-moving signal.

XRP’s recent price action in 2025 was more of a dynamic movement than a simple sideways drift. After rallying strongly earlier in 2025 and pushing to new all-time highs, the cryptocurrency has spent much of the recent months digesting those gains through pullbacks and consolidations.
That structure was referenced in a chart shared on the social media platform X by Steph, which proposed that XRP’s current market behavior is beginning to resemble the long compression phase that preceded its breakout in 2017.
XRP Completes Nearly 400 Days Of Sideways AccumulationAccording to Steph’s analysis, XRP has just completed roughly 393 days of sideways accumulation, a duration that almost perfectly matches the 395-day consolidation phase it went through between 2016 and 2017.
During that earlier cycle, XRP spent months moving within a relative range, producing a choppy price action. This kind of extended consolidation reflects a balance between buyers and sellers, where neither side is strong enough to force a decisive trend.
In 2017, that balance led to a transition into another technical formation of a descending channel before breaking out. The current setup in 2024-2025, at least structurally, shows XRP once again spending an unusually long time building a base in a range. A more detailed look at the chart shows another important similarity with the transition into another descending channel.
Back in the 2016-2017 cycle, XRP transitioned from sideways movement into a descending channel that gradually pushed the price lower over several months. That downward-sloping structure ultimately resolved with a sharp breakout to the upside.
The 2024-2025 chart shows XRP moving through a comparable descending channel, with price compressing toward the lower boundary before showing early signs of a breakout while attention is still low.
XRP Price Comparison. Source: @Steph_iscrypto on X
What To Expect For XRPThe 2016-2017 chart segment above shows XRP trading for roughly 395 days in a broad sideways range between about $0.005 and $0.01. Once XRP broke out of the descending channel in early 2017, price moved up very fast, first reclaiming $0.01, then surging past $0.03 and $0.05 within a few days. The expansion did not stop there, as XRP eventually rallied into the $0.40 region later that year, cementing XRP’s first 5,000% move in its history.
The 2024-2025 chart shows XRP peaking near the $3.40 zone before entering a sideways consolidation phase throughout 2025. Price action is now in the descending channel, which is gradually compressing around the $1.70-$1.90 area.
That channel now looks similar to the location where XRP was in 2017 before its breakout, adjusted for scale. A comparable 5,000% move from the current zone of price action would mathematically project the XRP price to about $100.
Featured image from Unsplash, chart from TradingView
Why this matters
XRP is a tracked market entity in the DigitalMoneyBox archive, making this useful context for readers monitoring repeated mentions and follow-up coverage.
Original source
Read on NewsBTCRelated market context

Binance co-founder Yi He shows $101.3 million account drop over 30 days
Yi He's account drop highlights the volatility and concentration risk in crypto investments, urging investors to consider diversif...

Crypto News Today: Bitcoin MVRV Near 1.1 Signals Possible Bottom as ETH and XRP Join Market Recovery
Bitcoin (BTC) traded at $64,946.14 after recovering from an early session low near $64,357. Ethereum (ETH) and XRP each gained 1.0...

XRP Price Prediction: Ali Martinez Identifies $0.78 Bottom as XRP’s 2017 Ascending Triangle Takes Shape
In his latest technical analysis, Martinez highlighted an ascending triangle that has been developing on XRP’s weekly chart since...
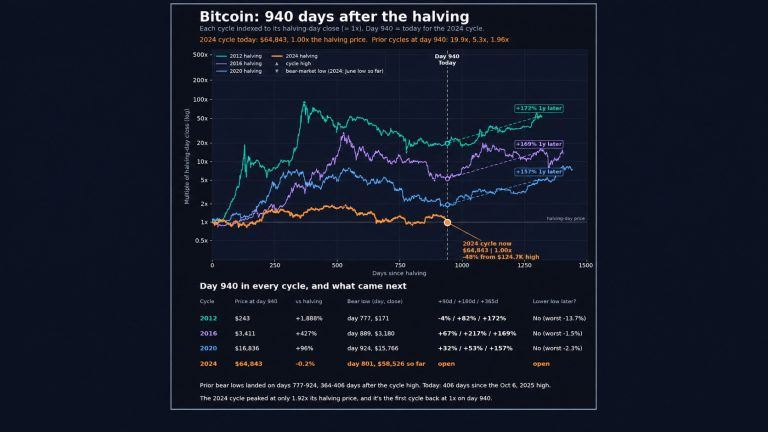
Bitcoin Price Is Flat 940 Days After Halving for the First Time Ever
Bitcoin’s price has round-tripped to almost exactly where it stood on the day of the April 2024 halving, 940 days later, a flat re...

George Mekhail: Bitcoin’s Price Is a “Distraction” as Wall Street Quietly Accumulates
▶Bitcoin Magazine George Mekhail: Bitcoin’s Price Is a “Distraction” as Wall Street Quietly Accumulates Retail built Bitcoin, Wall...

Sam Altman’s ChatGPT AI Predicts an Explosive 2027 for ETH
Ethereum trades near $1,780–$1,820 in mid-November 2026, well below its 2025 peak. Yet Sam Altman’s ChatGPT AI predicts a single t...