XRP Price Risks Plummeting Below $2 As Sellers Take Control
XRP is currently showing signs of vulnerability as its recent price action is becoming increasingly bearish. After attempting to reclaim upside momentum above $ 2.60 in May, the cryptocurrency has struggled to maintain t...
Archive context
Older archive item. Useful for background and entity history, but not a fresh market-moving signal.

XRP is currently showing signs of vulnerability as its recent price action is becoming increasingly bearish. After attempting to reclaim upside momentum above $ 2.60 in May, the cryptocurrency has struggled to maintain this run, and its price action over the past few days has brought it close to losing the $2.10 price level.
Notably, the price action has resulted in the formation of a head and shoulders pattern on the daily candlestick chart. This might be the final straw that finally sends the XRP price plummeting below $2.
XRP Breaks Head And Shoulders NecklineAs identified by a crypto analyst on the social media platform X, XRP has now printed a classic head and shoulders formation, with clearly defined symmetry between the left shoulder, head, and right shoulder. The head and shoulders formation began taking shape in late April, when the price climbed to $2.26 to become the left shoulder of the pattern. In early to mid-May, XRP surged above $2.60 to create the head of the formation and what appeared at the time to be a resumption of strong bullish momentum.
The rally lost steam soon after reaching that May peak, and the price began to retreat once again. By June 3, XRP made another attempt to push higher, reaching $2.27 in what is the formation of the right shoulder. However, this push wasn’t enough, and the ensuing price action has seen sellers gradually fighting for control.
The head and shoulders pattern, which is often associated with trend reversals, became more concerning once XRP broke below the neckline around the $2.18 level to reach as low as $2.07 on July 6. Interestingly, the breakdown below the neckline was accompanied by increased volume, which provided additional confirmation of the bearish signal.
EMA Rejections For XRP: What’s Next?Now that XRP has broken beneath the neckline, the $2.18 to $2.20 zone is beginning to flip into a firm resistance barrier for any attempt at recovery. The daily candlestick chart shows XRP continuing to trade below both the 9-day EMA and the 50-day SMA, which currently stand at $2.1877 and $2.2649 respectively.
Despite a modest recovery over the past 24 hours, XRP has repeatedly failed to break back above the 9-day EMA since the neckline breakdown, showing persistent weakness in the short-term structure.
As long as XRP is trapped beneath the neckline and the EMA/SMA resistance cluster, the prevailing structure continues to favor a downward extension. Based on the head and shoulders setup, a measured move from the neckline breakdown projects a decline toward the $1.85 to $1.80 range.
At the time of writing, XRP now finds itself trading at the neckline resistance again at $2.18 after a 2.6% increase in the past 24 hours from $2.13. However, the strength of this bounce is questionable, as it has occurred alongside a sharp 48.14% drop in trading volume. The next 24 hours will be important, as price behavior around the $2.18 to $2.20 range could determine whether XRP resumes its descent and break below $2.
Featured image from Unsplash, chart from TradingView
Why this matters
This altcoin story adds another data point to the current market tape and is useful when read alongside nearby source coverage.
Original source
Read on NewsBTCRelated market context
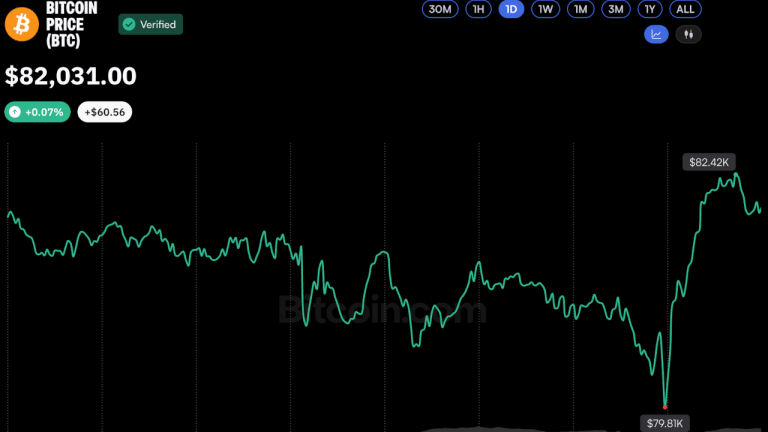
Bitcoin Price Rebounds Above $82K After Brief Dip Below $80K
Bitcoin staged a rapid recovery Thursday, climbing back above $82,000 to trade slightly higher over 24 hours with a market cap nea...

Coinbase’s x402 Records 138.5M Transactions: Chainalysis Shows AI Agents Reshaping Crypto Payments
According to blockchain analytics firm Chainalysis, activity has expanded sharply since the protocol’s early stages, as autonomous...

Bitcoin Briefly Slides Below $80,000 On More Hot Inflation Data
Bitcoin Magazine Bitcoin Briefly Slides Below $80,000 On More Hot Inflation Data Bitcoin’s price momentarily dipped below $80,000...

Binance US Chases $100 Million at a Fraction of Past Valuation: Bloomberg
Binance US is reportedly seeking up to $100 million in fresh capital at a valuation of roughly $1 billion, a striking reversal fro...

SEC Crypto: What do the Coinbase and MARA Binary Options Mean?
In SEC crypto news, the commission has reportedly approved standardized binary options that pay a predetermined cash amount if a s...

Bitcoin Price Prediction: Bitcoin Tracks Treasury Real Rates, Fidelity Finds
Bitcoin is trading at $82,000, rebounding from $80,000 since yesterday morning, as traders weigh a new macro signal that could fli...