XRP Price Set For 20% Leap In Coming Days: Crypto Analyst
In a recent technical analysis published by crypto analyst Egrag, an inverse head and shoulders (H&S) formation has been identified on the XRP/USD chart, indicating a potential bullish reversal in the near term. The patt...
Archive context
Older archive item. Useful for background and entity history, but not a fresh market-moving signal.

In a recent technical analysis published by crypto analyst Egrag, an inverse head and shoulders (H&S) formation has been identified on the XRP/USD chart, indicating a potential bullish reversal in the near term. The pattern, which has been forming over the last two weeks, suggests that XRP could be setting up for a significant price jump.
XRP Price Poised For Imminent 20% Jump?The chart by Egrag showcases the XRP price action in a 4-hour time frame, where it has been trading within a descending channel (blue) since the beginning of November. A descending channel is typically considered a bearish pattern.
However, last Wednesday, the XRP price broke out of the descending channel. While the breakout didn’t hold up and ended up being a fake-out, it paved the way for the emergence of the inverse H&S pattern which is now changing the momentum in favor of the bulls.
Technically, the inverse H&S pattern is distinguished by two smaller peaks (shoulders) on either side of a larger trough (head), which is evident from the chart’s annotations. The left shoulder formed around the $0.586 support level, with the head dipping as low as $0.574, before rising to form the right shoulder at $0.593.
This pattern is indicative of a bearish trend losing momentum and a potential bullish reversal if the pattern completes. Egrag’s analysis points to key price levels to watch, with the neckline of the inverse H&S pattern sitting at approximately $0.6289.
A decisive breakout above this resistance level could see XRP prices rally towards the $0.7000 mark, which aligns with the pattern’s predicted breakout target. Beyond this, the analyst’s target sits at $0.7311, which marked the beginning of the descending channel. A rally to this price level would represent a 20% increase from the current XRP price.
It is crucial to note that while the inverse H&S pattern suggests a bullish outcome, the validity of the pattern will only be confirmed upon a clear break and closure above the neckline. As always, while the technical setup is constructive for XRP bulls, market participants should consider various factors, including market sentiment, news flow, and broader market trends.
In a bearish scenario where the inverse head and shoulders pattern is invalidated, the XRP price could move towards the trend line of the descending channel. In his chart, Egrag marks $0.5564 and $0.53 as crucial support levels for the XRP price where a reversal could take place.
At press time, XRP traded at $0.61348. On the 1-day time frame, the 0.382 Fibonacci retracement level at $0.628 remains the key resistance level in the short-term.
Why this matters
This altcoin story adds another data point to the current market tape and is useful when read alongside nearby source coverage.
Original source
Read on NewsBTCRelated market context

XRP Price Could Surge 145% as 2023 Rally Pattern Returns
XRP price traded near $1.34 on October 16, about 4% below the 200-day simple moving average (SMA) at $1.36. The immediate test is...

Crypto Analyst Lark Davis: The Bitcoin Bull Run has Begun
Bitcoin Magazine Crypto Analyst Lark Davis: The Bitcoin Bull Run has Begun Bitcoin has been trading sideways in the $80Ks, but Lar...

Binance’s bStocks Lead Tokenized Stocks After Crossing $1 Billion
Binance’s tokenized U.S. equities product, bStocks, now holds more than $1 billion in assets under management, the exchange announ...
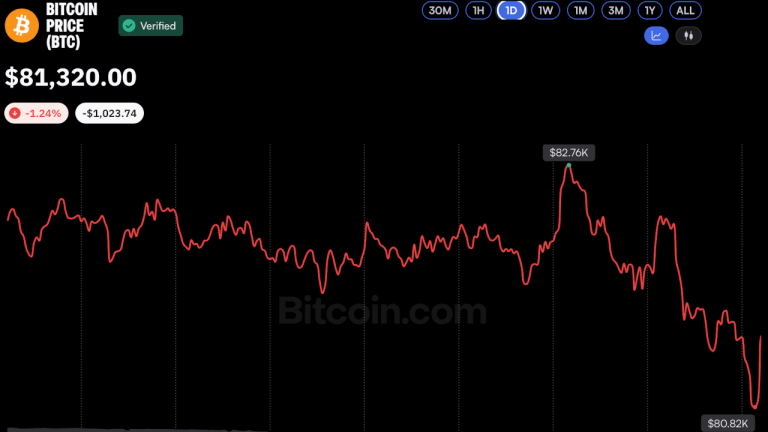
Bitcoin Price Hovers Near $81K as Analysts See Potential Market Bottom
Bitcoin slipped below $81,000 on Oct. 16 amid heightened market volatility, but analysts remained cautiously optimistic, suggestin...

Jio Platforms trades on crypto rails ahead of its record IPO
The use of crypto derivatives for pre-IPO trading could increase market volatility and influence traditional IPO pricing dynamics....

Bitcoin Price Prediction: Can BTC Rebound After a Brutal Sell-off?
Bitcoin is trading at $81,100, down 2.5% over 24 hours. The larger move has been rougher as it briefly slid toward $80,000 as soon...