XRP Set For Monumental Rally: Analyst Points To Extremely Rare Signal
The latest chart analysis by crypto analyst @Cryptobilbuwoo0, published via X, offers a compelling narrative for XRP’s potential upward trajectory when juxtaposed against the total cryptocurrency market capitalization. T...
Archive context
Older archive item. Useful for background and entity history, but not a fresh market-moving signal.

The latest chart analysis by crypto analyst @Cryptobilbuwoo0, published via X, offers a compelling narrative for XRP’s potential upward trajectory when juxtaposed against the total cryptocurrency market capitalization. The analyst emphasizes key technical indicators and historical patterns, suggesting that XRP might be on the brink of a significant bullish phase.
XRP Price Poised To “Bounce”The XRP/Total chart primarily illustrates a descending trajectory that began forming from its early 2018 peak. This overarching downtrend is marked by successive lower highs that articulate a consistent descending trendline.
Moreover, @Cryptobilbuwoo0 highlights the ‘Bounce Back Line,’ a horizontal support line that has historically acted as a crucial reversal point for the XRP price action. The chart shows several instances where the price of XRP, upon reaching this line, has rebounded dramatically.
The last instance of XRP interacting with the “Bounce Back Line” was on December 28, 2020. Following this touchpoint, the price soared over 1,100%, climbing from $0.18 to $2. Earlier, on February 27, 2017, XRP escalated from just under $0.02 to $3.35 within 10 months. Currently, XRP is once again nearing the “Bounce Back Line.” Given the historic outcomes following support from this level, the analyst predicts another significant rally may be on the horizon.
The chart analysis further deepens with a nuanced look at the Relative Strength Index (RSI) and the Wavetrend Indicator (WT Krypt), which are pivotal to understanding the market’s momentum and potential reversals. The 14-day RSI is currently nearing 31, approaching the oversold territory which historically signals a buying opportunity or a trend reversal. This is evident in the past markings on the chart, where similar RSI levels have coincided with the “Bounce Back Line” and substantial upward price movements.
The Wavetrend Indicator, used for spotting the start and end of cycles in the cryptocurrency’s price, has shown several bullish signs. Bullish divergences have been a critical focus, occurring when the price of XRP makes new lows while the indicator does not follow suit, suggesting a decrease in downward momentum. Moreover, the recent crossover of the Wavetrend lines (red crossing over blue) is typically interpreted as a bullish entry signal, indicating potential upward price movement.
In addition to the primary indicators, the analyst has annotated the chart with past price actions and highlighted areas and patterns, such as bullish divergences. These annotations serve to emphasize significant trading zones and anticipated trend shifts based on historical data. The marked sections of the chart indicate that each time similar conditions were met, there followed a significant increase in the XRP price, reinforcing the bullish outlook presented in the current analysis.
@Cryptobilbuwoo0’s analysis suggests that XRP, currently positioned at a historically significant price level and supported by bullish indicator signals, is poised for a potential breakout. This outlook is bolstered by the RSI nearing oversold conditions and the positive signals from the Wavetrend Indicator. If the historical pattern repeats, the crypto asset could see a substantial rally, affirming the analyst’s perspective:
Looking at the XRP/Total chart, XRP has always risen significantly from the rebound line. Indicators are also calling the bulls. XRP always moves alone like a maverick. XRP’s showtime begins.
At press time, XRP traded at $0.49.
Why this matters
This altcoin story adds another data point to the current market tape and is useful when read alongside nearby source coverage.
Original source
Read on NewsBTCRelated market context
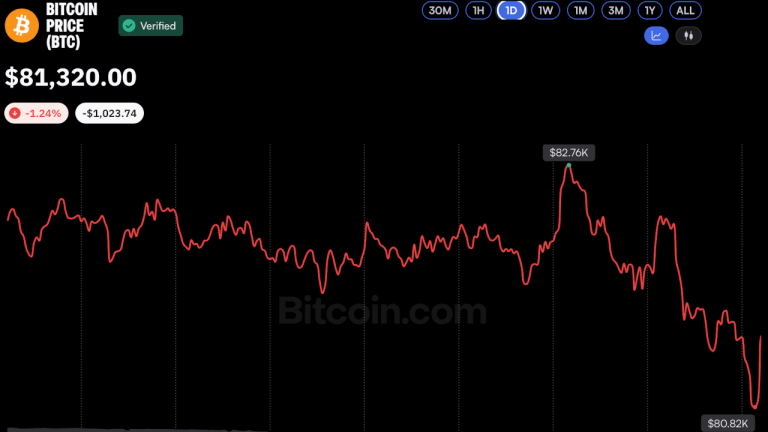
Bitcoin Price Hovers Near $81K as Analysts See Potential Market Bottom
Bitcoin slipped below $81,000 on Oct. 16 amid heightened market volatility, but analysts remained cautiously optimistic, suggestin...

XRP Price Could Surge 145% as 2023 Rally Pattern Returns
XRP price traded near $1.34 on October 16, about 4% below the 200-day simple moving average (SMA) at $1.36. The immediate test is...

Ripple Brings RLUSD to Cross River Bank as Garlinghouse Backs Evernorth’s XRP Strategy
Announced on October 15, the Cross River partnership integrates Ripple USD (RLUSD) into the bank’s proprietary Core Operating Syst...

Gemini Can’t Shed Its CFTC Consent Order Even With the Agency’s Backing, Judge Rules
A federal judge in Manhattan on Thursday refused to vacate Gemini’s 2025 settlement with the Commodity Futures Trading Commission,...

OKX Marketing Chief Haider Rafique Steps Back After Seven Years at Crypto Exchange
Key Takeaways: After nearly seven years at OKX, Haider Rafique has decided to step aside due to family and various personal reason...
Bitcoin steadies near $82,000 as Warsh declines to signal another Fed hike
Bitcoin's resilience amid market volatility highlights its potential as a hedge against economic uncertainty and shifting monetary...