XRP To Hit $8 In The ‘Upcoming Days,’ Predicts Crypto Analyst
Crypto analyst Dark Defender (@DefendDark) has released an updated technical chart that indicates XRP could be on track to reach the long-anticipated $8 price level in the “upcoming days.” The chart, shared on X yesterda...
Archive context
Older archive item. Useful for background and entity history, but not a fresh market-moving signal.

Crypto analyst Dark Defender (@DefendDark) has released an updated technical chart that indicates XRP could be on track to reach the long-anticipated $8 price level in the “upcoming days.” The chart, shared on X yesterday, depicts an Elliott Wave structure complete with clearly defined support and resistance levels, along with a noteworthy correction currently taking place below the $3 price zone.
The analyst first teased the chart on X: I will explain how XRP is expected to target $8 in the upcoming days with key levels and my enter and exit strategies […] I will share it on X […].” He later shared the chart and explained: “XRP continues the daily correction and consolidates under the $3 level, which will be the breakeven point for continuing with our targets. Wave 3 indicates $5.85 is at sight and closer than ever before. This structure aims at $8+ levels with its 5th Wave shortly.”
The XRP Price Analysis Broken DownAccording to Dark Defender’s latest daily chart, XRP has been trading within a descending channel (identified by two white trend lines), from which it previously broke out. The analyst denotes five impending waves (labeled (1) through (5)) in an Elliott Wave formation. Wave (1) peaks near $3.3999, while the subsequent correction, labeled (2), dips back inside the Ichimoku Cloud region on the chart.
At the chart, XRP hovers around $2.56, and the analyst emphasizes the $3 critical level as the necessary “breakeven point” for resuming bullish momentum toward higher targets. The XRP price needs to break through the top white trendline on the chart to build momentum in Wave (3).
The chart also features a highlighted 261.8% Fibonacci extension line around $5.8563, signaling a projected Wave (3) objective. After a presumed Wave (4) pullback below $4.50, Wave (5) targets $8+ — a zone that Dark Defender believes XRP could reach “shortly.”
In the comment section beneath the post, one user, @pommapomatum, questioned whether XRP’s second wave legitimately dipped below the start of Wave (1), a move typically inconsistent with classical Elliott Wave theory. Dark Defender responded by citing a historical precedent from December 6, 2017.
“You are right. However, when we check XRP history, we see similar wicks down to clear the way for the next move. We had this type of extraordinary move on December 6, 2017. XRP went from 30 cents to 0.002 cents and then within a month, XRP hit the ATH at $3.82,” Dark Defender stated.
@pommapomatum countered that the 2017 wick has been exchange-specific and not indicative of market-wide conditions. Dark Defender acknowledged this concern, noting that not all platforms showed the dramatic wick in 2017 and that the same discrepancy appeared yesterday on certain exchanges.
“It was the same case yesterday. Not all the exchanges had the same wick. E.g. Kraken. I think that is an exception and chosen to exclude that wick but candle close,” the analyst remarked.
Notably, the Ichimoku Cloud on the chart underscores ongoing consolidation as XRP’s price moves beneath the $3 threshold. Dark Defender describes this support zone as key for bullish continuation, noting that a decisive break above $3 would confirm the next major wave toward $5.85 (Wave (3)) and, ultimately, an $8+ target (Wave (5)) if the pattern follows through as envisaged.
At press time, XRP traded at $2.50.
Why this matters
This altcoin story adds another data point to the current market tape and is useful when read alongside nearby source coverage.
Original source
Read on NewsBTCRelated market context

Bitcoin Price Prediction: Bitcoin Tracks Treasury Real Rates, Fidelity Finds
Bitcoin is trading at $82,000, rebounding from $80,000 since yesterday morning, as traders weigh a new macro signal that could fli...

Small and mid-cap crypto outpaces Bitcoin since late August, CryptoQuant analyst says
The shift towards small and mid-cap crypto suggests increased risk appetite, but this trend may reverse quickly due to market vola...

Bitcoin Price Forecast: $81,500 Leaves Weekly Close Needing a Big Push
Sunday’s (October 18) Bitcoin price forecast puts it near $ 81,600, with technical indicators sending mixed signals. Shorter-term...
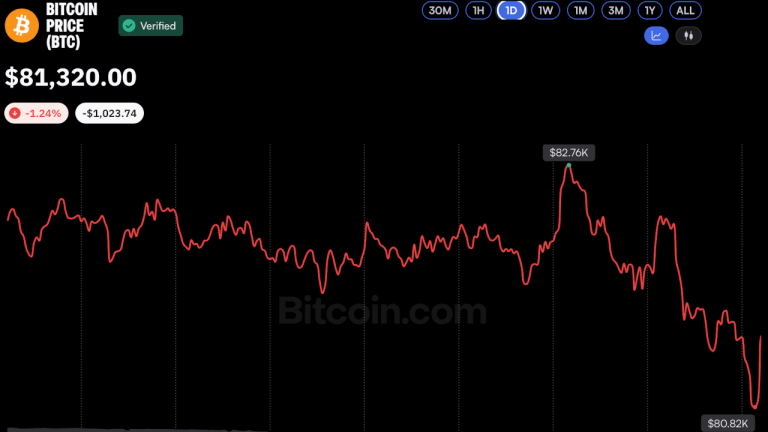
Bitcoin Price Hovers Near $81K as Analysts See Potential Market Bottom
Bitcoin slipped below $81,000 on Oct. 16 amid heightened market volatility, but analysts remained cautiously optimistic, suggestin...

Crypto Analyst Lark Davis: The Bitcoin Bull Run has Begun
Bitcoin Magazine Crypto Analyst Lark Davis: The Bitcoin Bull Run has Begun Bitcoin has been trading sideways in the $80Ks, but Lar...

Bitcoin Price Prediction: Can BTC Rebound After a Brutal Sell-off?
Bitcoin is trading at $81,100, down 2.5% over 24 hours. The larger move has been rougher as it briefly slid toward $80,000 as soon...