XRP’s Path To $15: A Look At Historical Price Alignments
In a technical analysis shared by crypto analyst Bobby A (@Bobby_1111888) on X, the analyst projects that XRP will potentially reach the $15 mark in this bull run, contingent upon historical price movement patterns align...
Archive context
Older archive item. Useful for background and entity history, but not a fresh market-moving signal.

In a technical analysis shared by crypto analyst Bobby A (@Bobby_1111888) on X, the analyst projects that XRP will potentially reach the $15 mark in this bull run, contingent upon historical price movement patterns aligning. The analysis delves into XRP’s past market cycles, applying percentage-based extrapolations and chart pattern assessments to forecast future price trajectories.
Is A XRP Price Of $15 Realistic?Bobby A’s analysis juxtaposes XRP’s performance during its 2017 market cycle against its current 2024 trajectory. From the range-high breakout in 2017, marked by a horizontal black dashed line on the chart, XRP experienced an initial appreciation of 629%.
In comparison, the asset has appreciated approximately 331% since its range-high breakout in 2024. Extending further back, from the December 2014 high to the May 2017 peak—approaching the 4.236 Fibonacci extension—XRP saw a staggering 1,330% increase.
Applying the principle of reducing percentage point increases by half, as observed from the initial surge in 2017, Bobby A posits that XRP’s next impulse could result in a 665% increase. This calculation positions XRP at an approximate $15.00 near the 4.236 Fibonacci extension level.
“XRP appears to be cutting its percentage point increases in half compared to its 2017 market cycle. If XRP cuts its next impulse in half from a percentage point increase perspective, as it did with this first one, it would put the asset’s price at roughly ~$15.00 near its 4.236 extension after a possible 665% increase,” Bobby A elaborates.
Notably, the analyst also notices a developing bull flag pattern, a continuation pattern that typically signals the potential for further upward movement. This bull flag is targeting the upper boundary of XRP’s macro parallel channel, estimated around the $10.50 price level. “The current bull flag the asset is forming targets the top of its macro parallel channel near $10.50,” Bobby A notes.
Another analyst, bassii (@cryptobassii), responded with a contrasting viewpoint centered on fractal analysis. Bassii posits that the ongoing run may be curtailed by 42%, projecting XRP’s price to approach $9, followed by a significant downturn.
He elaborates on the fractal patterns, stating, “This run seems to be cut to 42%, would get us close to $9, then a big drop. But you’re missing the last part of the 2017 run, IF (big if) that happens, and we keep same %, we get around $30 after months of accumulation.”
Or Even $35?Bassii referred to a previous analysis of himself where he emphasized the similarities between the 2024 run and the 2017 cycle. Notably, both periods exhibit five weeks of consecutive green candles, albeit with differing magnitudes—approximately 500% in 2024 compared to 1,200% in 2017.
He points out, “2017: 5 weeks of green candles at ~1,200% ^, followed by 3 weeks of red candles down 63%. 2024: Also, 5 weeks of green candles at ~500% up (~1/2 of 2017’s run), followed by… (so far) 1 week of red candles by how much? You guessed it… 30% down.” The subsequent correction phases also mirror each other, with XRP experiencing a 30% decline in 2024 compared to a 63% drop in 2017, each roughly halved in magnitude.
Based on this, Bassii outlines potential future movements based on historical patterns, suggesting that if XRP continues to follow these fractal patterns without significant breakdowns, it could accumulate over several months and potentially ascend to $30 by September 2025.
Responding to Bassii’s analysis, Bobby A expresses cautious optimism, stating, “Yeah but I’m not sure that the last impulse will come. The next one I’m much more confident in.” Bassii complements this by highlighting the importance of adhering to fractal patterns and real-time chart developments, adding, “I think it will depend on how closely we follow the fractals and what the chart tells us during this upcoming run. So far it’s followed very very closely. The weekly candles for the last 8 weeks have followed beat by beat. I’m not a moon boy, I know how crazy $30-35 sounds. But if we’re still tracking the 2017 run.”
At press time, XRP traded at $2.1581.
Why this matters
This altcoin story adds another data point to the current market tape and is useful when read alongside nearby source coverage.
Original source
Read on NewsBTCRelated market context

Bitcoin Price Prediction: BTC Reclaims $82K as Oil Retreats and Bulls Return
Bitcoin reclaimed $82,000 today, trading at $82,800, bouncing up by 1.5%. The bounce follows two weekly declines and puts price ba...
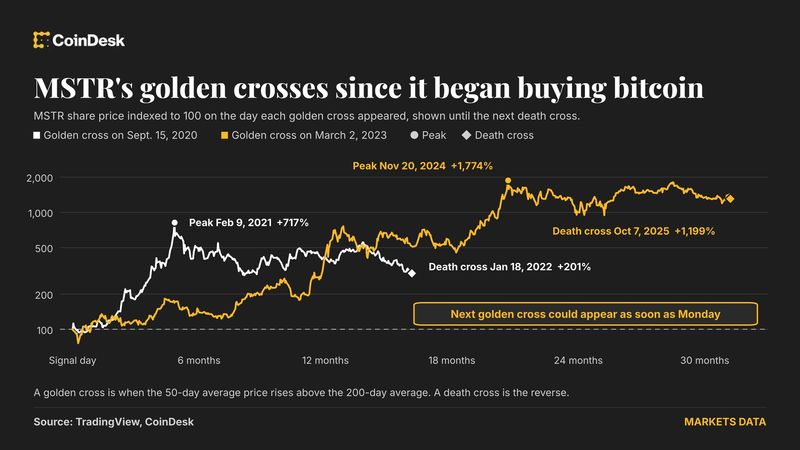
Strategy on verge of golden cross, just weeks after bitcoin flashed same bullish signal
Your day-ahead look for Oct. 19, 2026

XRP Price Prediction: Elliott Wave Setup and Descending Trendline Breakout Offer Hope as XRP Tests $1.30
However, resistance and weakening order-book demand continue to complicate XRP’s near-term outlook. The current price forecast hin...

XRP Price Prediction: Key Support Holds Through Volatility, $2 Next?
XRP is trading near $1.31, up 1.4% over 24 hours, but that bounce has not yet reversed the lower-high structure. The immediate tes...

Bitcoin (BTC) Price Prediction: Glassnode Signals Potential Price Floor Near $80K as Sellers Capitulate
Similar spikes in Bitcoin’s realized losses preceded local price bottoms in August and September, raising the possibility that the...
No ‘Uptober’ Yet: Bitcoin Slips 2% in a Month That’s Historically Bullish
Bitcoin Magazine No ‘Uptober’ Yet: Bitcoin Slips 2% in a Month That’s Historically Bullish Bitcoin’s price retook $82,000 on Monda...