Bears In Trouble? Bitcoin Liquidity Signals A Brutal Squeeze To $111,000
While the Bitcoin price is hovering below the crucial resistance at $96,500, the liquidation heatmap on Binance’s BTC/USDT pair is sending powerful signals of a potential short squeeze to the upside. Analyst Kevin (@Kev_...
Archive context
Older archive item. Useful for background and entity history, but not a fresh market-moving signal.

While the Bitcoin price is hovering below the crucial resistance at $96,500, the liquidation heatmap on Binance’s BTC/USDT pair is sending powerful signals of a potential short squeeze to the upside. Analyst Kevin (@Kev_Capital_TA) shared his insights alongside the attached liquidation heatmap, noting signs of significant liquidity pools forming both above and below Bitcoin’s current trading range.
“What we’re seeing over the last couple of days is lining up perfectly with what I have been saying,” Kevin explained, referencing his earlier market calls. “Sweep liquidity towards 91K which we did yesterday. Maybe we take more maybe we don’t but overall I have never seen this much liquidity to the upside on the monthly time frame on #BTC.”
According to Kevin, the data strongly suggests that large liquidity—where traders’ positions would be forced to liquidate—is now stacked around the 91K region and, more crucially, near the 111K mark. While the lower zone might still see occasional sweeps, it is the massive cluster of liquidity around 111K that has prompted him to forecast a potential move to that level.
“There is more emotions in this market right then I have ever seen,”he continued. “Gurus are quitting X, Youtubers aren’t streaming or making content anymore, The comments are hateful and insulting every single day […] Meanwhile over here we are staying measured and calculated.”
Kevin emphasizes that many market participants are fixated on altcoins rather than monitoring Bitcoin’s liquidity structure, overall market capitalization, and USDT dominance. He argues that traders’ narrow focus on individual altcoins, rather than these broader metrics, is causing them to miss critical signals.
“The problem is everyone is hyper focused on the wrong thing and that is #Altcoins charts,”he said. “I’m literally giving you the playbook. Follow it.”
What The Bitcoin Liquidation Heatmap Tells UsA liquidation heatmap illustrates where large batches of leveraged positions—such as futures or margin trades—are most likely to be force-closed if the price reaches certain levels. When many traders place stop-losses or maintain heavily margined trades around similar price points, these zones often accumulate as “hot spots” on the heatmap. If price action nears these clusters, it can trigger a chain reaction: forced liquidations drive further price movement, which can then cascade into a faster squeeze or sell-off.
In Kevin’s view, Bitcoin’s heatmap currently shows billions of dollars in potential liquidations concentrated at higher levels (111K) and a significant liquidity block below (around 91K). The presence of this deep liquidity on the upside has led Kevin to anticipate a “bigger relief rally” that might force out short positions en masse.
“Now as we can see […] we have billions in liquidity to the upside at 111K. More than I have ever seen on the 1M time frame,” he remarked, emphasizing how unusual he finds this month-long concentration. “It would be totally fine and preferable if we swiped [the 91K area] first to build up even more liquidity to then start the real relief rally.”
Alongside liquidity data, Kevin also cites sentiment indicators such as the Fear & Greed Index, currently reflecting a “fear” reading. From his standpoint, this environment suggests that the market’s emotional extremes—coupled with heavy positioning—could be setting the stage for a swift momentum shift higher, as negative sentiment often accompanies local bottoms.
“You can tell this relief rally wants to get going but it’s just not totally there yet […] I see no reason to be overly bearish on this market. You guys need to calm down and stop being so angry. Stop being so soft.”
At press time, BTC traded at $96,334.
Why this matters
This bitcoin story adds another data point to the current market tape and is useful when read alongside nearby source coverage.
Original source
Read on NewsBTCRelated market context
DeFi Giant Uniswap Taps 7 Rival Liquidity Sources to Burn UNI Tokens
The decentralized exchange (DEX) platform Uniswap has turned DEX competitors into potential revenue sources for its UNI token-burn...

Arf partners with Ripple to bring RLUSD settlement liquidity to the XRP Ledger
The partnership could revolutionize cross-border payments by reducing idle capital, enhancing liquidity, and potentially influenci...

Mark Zuckerberg Meta AI Predicts an Insane Run for BTC in Q4
Something potentially seismic could be approaching for Bitcoin by January 1, 2027. Mark Zuckerberg’s Meta AI predicts that if a fu...
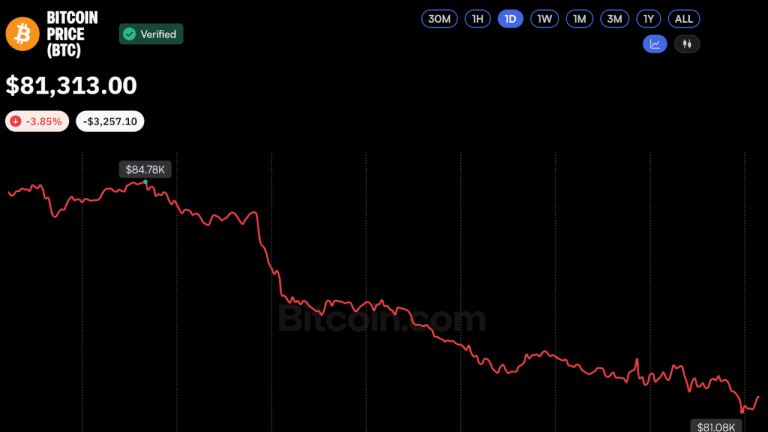
Bitcoin Price Plunges Below $81K Despite $1 Billion in ETF Inflows
Bitcoin dropped below $82,000 to an intraday low of $80,836 during a late Wednesday sell-off, capping a nearly 4% daily loss and h...

XRP Price Falls as Crypto Longs Get Wiped Out and XRPL Upgrade Delayed
The XRP price fell below $1.35 just now after an attempted recovery toward $1.40 lost momentum. Not just XRP, renewed selling pres...

Dune launches real-time onchain trading data feeds for tokenized markets
Dune's real-time data feeds could bridge onchain and traditional finance, enhancing market efficiency and risk management for inst...