Bitcoin (BTC) Price Prediction: Slowing Whale Selling Offers Hope as $81.5K ETF Support Holds
On-chain data indicates that distribution from longer-term holders has slowed, offering some relief to the market. However, weakening bullish momentum and persistent overhead resistance leave the next Bitcoin price move...
Watchlist
Published in the last two hours. A tracked entity is involved.

On-chain data indicates that distribution from longer-term holders has slowed, offering some relief to the market. However, weakening bullish momentum and persistent overhead resistance leave the next Bitcoin price move dependent on whether buyers can defend key support and reclaim higher levels.
Bitcoin Price Today: BTC Struggles to Break Above $84KBitcoin continues to trade within an $82,500–$86,500 range, but recent price action suggests that buyers are struggling to regain control. According to a technical analysis published by TradingView contributor inchartswetrust, BTC has faced rejection at $84,000 seven times since Sunday, preventing a sustained move toward the upper boundary.
Bitcoin recorded a second false breakdown below $82,500 in 24 hours, with the 4-hour 200 EMA providing strong support and triggering another rebound. Source: inchartswetrust on TradingView
The repeated rejections are significant because $84,000 represents the midpoint of the current trading range. Although the price has recovered after briefly falling below $82,500, those rebounds have failed to generate lasting upward momentum. Similar attempts on October 8 and October 13 lost strength near the same resistance level.
The analyst also identified the four-hour 200-period exponential moving average (EMA) as an important source of support. The indicator has helped reverse two previous breakdown attempts, suggesting that buyers remain active during short-term declines. However, repeated tests of support can leave the market vulnerable if demand weakens.
For the near-term BTC price outlook, reclaiming $84,000 would provide an initial indication that buying pressure is improving. Until that happens, Bitcoin remains exposed to another test of the lower end of its trading range.
Bitcoin ETF Cost Basis at $81.5K Remains a Key SupportOn-chain analytics firm Glassnode has identified the US spot Bitcoin ETF investor cost basis near $81,500 as an important market threshold. BTC has rebounded from this level twice in 2026, making it a closely watched reference point for assessing demand from ETF investors.
Bitcoin has rebounded twice from the US spot ETF cost basis near $81,500, establishing support after trading below that level for most of 2026. Source: @glassnode via X
The level also carries historical significance. During the May 2026 rally, Bitcoin’s advance stalled just below the ETF cost basis, highlighting its potential role as both support and resistance depending on market conditions. Its recent ability to hold as support offers some reassurance, although it does not guarantee that buyers will defend it during another decline.
If BTC falls below $81,500 and fails to recover, Glassnode’s True Market Mean near $77,500 becomes the next major on-chain level to watch. This metric provides another reference point for evaluating Bitcoin’s market valuation relative to the aggregate cost basis of active investors.
The chart shows longer-term buyer cost bases still acting as overhead supply, limiting BTC upside while price consolidates above key on-chain averages. Source: Glassnode via X
Meanwhile, Glassnode’s data indicates that a previous rally toward $88,000 encountered resistance near the break-even level for holders who acquired BTC six to 12 months earlier. The subsequent distribution from wallets holding coins for one to two years has slowed considerably.
The easing of this selling pressure could reduce one source of supply in the market. Nevertheless, longer-term holders’ cost bases remain potential overhead resistance, meaning Bitcoin may need stronger demand to sustain a recovery.
BTC Price Prediction: Can Bitcoin Reclaim $88K?Technical analyst AliCharts has identified an ascending parallel channel on BTC’s four-hour chart. Under this structure, the recent rebound from the lower boundary creates a potential path toward $88,000 near the channel’s midpoint, followed by $93,000 if upward momentum continues toward the upper boundary.
Bitcoin has bounced from its 4-hour ascending channel support, targeting $88,000 mid-channel and potentially $93,000 at the upper boundary. Source: Ali Martinez via X
These levels represent technical scenarios rather than confirmed price targets. BTC would first need to establish stronger support and overcome the repeated resistance around $84,000 before a sustained advance becomes more convincing.
The immediate bullish scenario depends on BTC holding $82,500. If buyers defend this level and push the price above $84,000, Bitcoin could move toward the upper end of its current $82,500–$86,500 range. A breakout above $86,500 would strengthen the recovery structure and bring higher resistance levels into focus.
The bearish scenario begins with a decisive break below $82,500. In that case, $80,000 would become the next major level to monitor. This price area previously acted as resistance, making it a potentially important test for buyers attempting to prevent a deeper correction.
A sustained move below $80,000 could expose the $76,000–$80,000 trading range. Bitcoin’s ability to establish or recover support around these levels would help determine whether the decline represents a temporary setback or a broader deterioration in market structure.
Looking Ahead: Whale Selling and Market Supply Remain in FocusSlowing distribution from older Bitcoin holdings provides a constructive development, but it should not be interpreted as definitive evidence that large holders have resumed accumulating BTC. A reduction in selling activity can ease supply pressure without necessarily generating enough demand to drive prices higher.
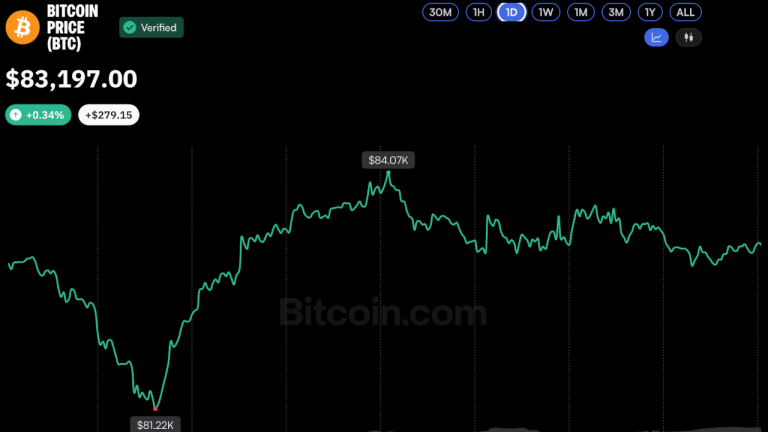
Bitcoin (BTC) price chart. Source: Brave New Coin
The ETF cost basis also offers a useful measure of investor positioning. When BTC trades above this level, ETF investors who acquired exposure near the average cost may remain in a more favorable position. A sustained decline below it could weaken sentiment and increase attention on lower support levels.
Bitcoin’s longer-term recovery will depend on several factors, including spot demand, ETF-related flows, the behavior of long-term holders, and its ability to overcome established resistance. The supplied market data identifies $81,500 as a key support reference, while $84,000 remains the immediate hurdle for a stronger short-term recovery.
For now, the Bitcoin price prediction remains conditional. Holding $82,500 and reclaiming $84,000 would improve the technical outlook, while a breakdown could bring $80,000 and potentially $77,500 into focus. Slower whale selling offers some relief, but buyers still need to demonstrate that demand can sustain a move beyond the current range.
Why this matters
Bitcoin is showing up inside the Bitcoin ETF theme, so this story is worth tracking for follow-through rather than treating it as a one-off headline.
Original source
Read on Brave New CoinRelated market context

Hyperliquid (HYPE) Price Today: HYPE Holds $80 Support Despite Mounting Bearish Pressure
CoinGecko data puts Hyperliquid’s market capitalization at approximately $18.04 billion and its daily trading volume near $918 mil...

Ethereum Price Prediction: Tom Lee Warns of ETH Drawdown After Kospi Bloodbath
Ethereum is trading at the $2,500 level as Tom Lee warns that Korea’s equity rout could spill into crypto, a bearish price predict...

Bitcoin Price Prediction: Strategy Chairman Calls $100K BTC
Bitcoin is trading near $83,500 after recovering from a liquidation-driven slide toward $81,000. Strategy executive chairman Micha...

Grok AI Predicts Hyperliquid to Surge 20x by 2027
Elon Musk’s Grok AI predicts that Hyperliquid (HYPE) could reach $1,500 by January 1, 2027, assuming a full-blown crypto bull mark...
Bitcoin Price Defends $81.5K ETF Cost Basis Despite Rising Outflows
Bitcoin has twice defended the roughly $81,500 cost basis of U.S. spot ETF investors, even after $681 million in net ETF outflows...

Bitcoin price stalls near $88K as selling pressure slows
Bitcoin's stalled rally highlights the market's vulnerability to long-term holder sell-offs, impacting future price stability and...