Bitcoin Crash On Feb. 5 Was Historic: The Numbers Behind The Selloff
Bitcoin printed one of the largest ever daily candles to the downside on Thursday, sliding more than 15%, roughly $10,800, in a move that rippled through derivatives, spot venues, and the US Bitcoin ETF complex. The scal...
Archive context
Older archive item. Useful for background and entity history, but not a fresh market-moving signal.

Bitcoin printed one of the largest ever daily candles to the downside on Thursday, sliding more than 15%, roughly $10,800, in a move that rippled through derivatives, spot venues, and the US Bitcoin ETF complex.
The scale of the drop is what made it stand out. Not just the percentage drawdown, but the mix of stress signals hitting at once: implied volatility spiking, volumes exploding, and momentum gauges collapsing into levels typically associated with forced selling rather than discretionary risk reduction.
Bitcoin Crash Sparks Capitulation SignalsReal Vision’s Jamie Coutts framed the session as a “capitulation watch,” pointing to a cluster of metrics rarely seen together. He highlighted Bitcoin implied volatility via BVIV at 88.55, “closing in on the FTX-collapse peak of 105,” and noted Coinbase logged its eighth-largest trading day ever by USD value, with $3.34 billion changing hands—roughly 54,000 BTC at ~$62,000.
Coutts also underscored how extreme the momentum reset looked on daily charts, citing a daily RSI of 15.64, “at or below March 2020 COVID crash lows.” He added: “Margin calls are firing. Forced liquidations are likely still working through the system. This has the signature of a capitulation event, but capitulation can be a process, not a single candle (unless we get a massive wick!). These conditions can persist for weeks or even months before a durable low forms.”
Macro trader Alex Krüger stopped short of a price target for the lows, but argued the market was registering the kind of positioning and pricing distortions that tend to cluster around turning points in time.
“Friends I really do not know where the bitcoin bottom is but I can recognize extreme conditions that you only see close to bottoms in time, such as extreme negative funding, options skew at levels only seen once before since 2022 (FTX day), and volumes & liquidations at extraordinary levels,” he wrote. “You also have some monster shorts that opened between 64k and 60k, material for a short squeeze sending price to 68k, and if we see so then everyone will start talking about the bottom.”
Krüger’s caveat was just as direct: “In the meantime of course equities need to hold. And having a bottom in does not mean that you will see a major trend from here.”
Galaxy’s Alex Thorn described the tape as historically stretched on RSI measures, saying bitcoin was “the most oversold today than any day since 3AC blew up in June 2022 (30d RSI),” and calling it “basically in the top 3 oversold events ever,” alongside November 2018 and June 2022.
The US spot Bitcoin ETF market didn’t cushion the move, it amplified the day’s activity. Bloomberg Intelligence’s Eric Balchunas said BlackRock’s iShares Bitcoin Trust (IBIT) “just crushed its daily volume record with $10b worth of shares traded” as the fund’s price fell 13%, its second-worst daily drop since launch.
Head of Research for Anchorage Digital David Lawant added that IBIT alone trading above $10 billion was the highest since launch, beating prior records by 69% in shares and 27% in USD volume.
Positioning data hinted at a complex, two-sided ETF ecosystem. Head of Research at K33 Research Vetle Lunde noted net equivalent short exposure in short BTC ETFs was nearing the November 2022 peak at 7,745 BTC, while 2x leveraged long BTC ETFs—products that didn’t exist then—currently hold 39,590 BTC, “at levels not seen since Mar 24.”
Volatility remained the throughline. ProCap CIO Jeff Park said: “Bitcoin implied vol is now at 75%. This is the highest level since the ETF launch in 2024. It is also finally higher than gold volatility. Know it’s a lot of pain right now, but this is all part of the process required for Bitcoin to make new highs. The melt up will be fast.”
At press time, BTC rebounded from $60,000 to roughly $64,900, a gain of about 9% from the session low.
Why this matters
Bitcoin is showing up inside the Bitcoin ETF theme, so this story is worth tracking for follow-through rather than treating it as a one-off headline.
Original source
Read on NewsBTCRelated market context

XRP Whales Dominate Exchange Outflows as Bitcoin Shorts Rise on Hyperliquid
The contrasting flows highlight a market where some large investors are moving XRP away from exchanges even as leveraged traders p...
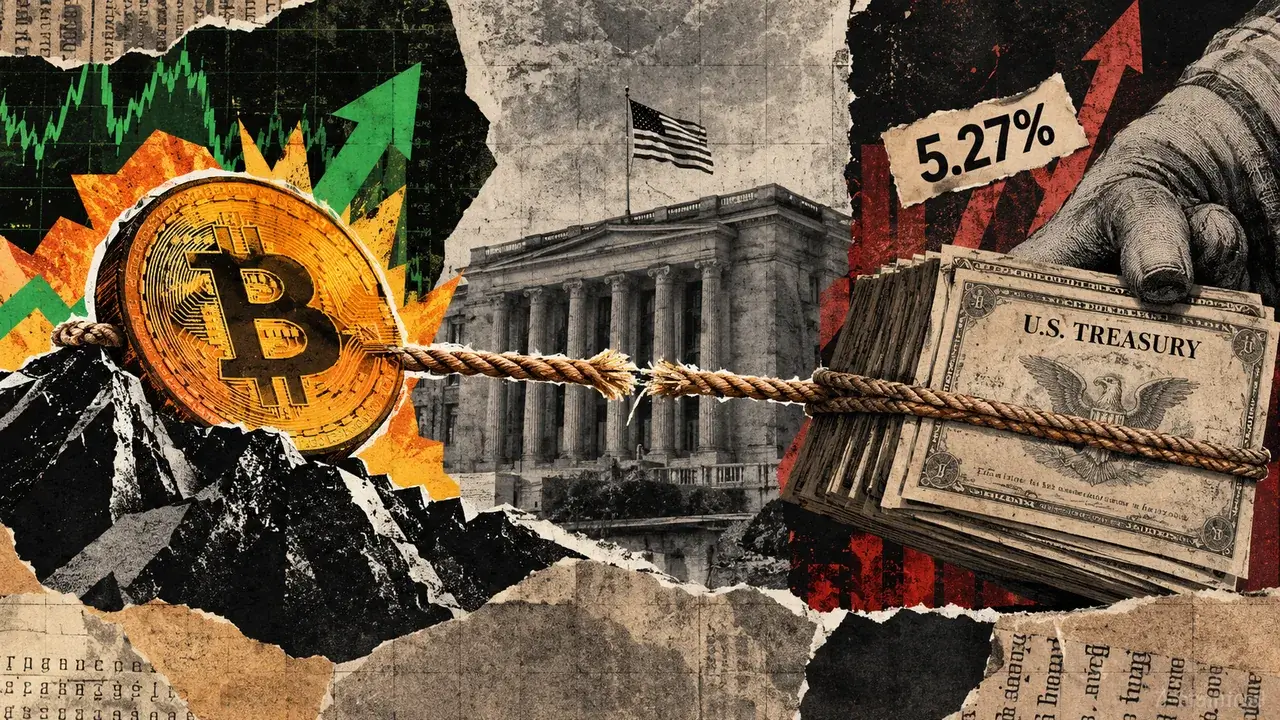
Bitcoin price has risen 84% since January 2024 while Treasury yields climbed
Bitcoin traded below $84,000 on Oct. 7 as US Treasury yields near 5.3% offered investors a competing interest-bearing alternative....

US Government Moves $103M in Seized Bitcoin and BNB to Coinbase Prime, Raising Sale Questions
The Bitcoin and BNB transactions drew attention because Coinbase Prime provides institutional custody and trading services for dig...

XRP ETFs now hold $1.7 billion but took in just $4M last week
XRP traded around $1.43 on Oct. 7, down 5.46% over 24 hours. Five tracked US spot XRP ETFs held an estimated $1.7 billion at the p...

Coinbase Pro Returns With Deribit, Unlocking $30B Bitcoin Options Liquidity
Key Takeaways: Coinbase Pro returns with Spot, Futures, Perpetuals, Options, and Equities by the end of the year. Deribit is upgra...
Bitcoin Drops Under $84,000 as $487 Million in Leveraged Longs Get Liquidated in 24 Hours
Bitcoin fell below $84,000 late Tuesday as traders holding leveraged long positions were forced out of their trades. Coinbase exch...