Bitcoin Cycle Structure Questioned As VDD Mirrors Historic Tops
Bitcoin is trading above the $112,000 level, but its momentum is faltering as selling pressure intensifies. Analysts are divided on what comes next, with some calling for another correction and others suggesting that BTC...
Archive context
Older archive item. Useful for background and entity history, but not a fresh market-moving signal.

Bitcoin is trading above the $112,000 level, but its momentum is faltering as selling pressure intensifies. Analysts are divided on what comes next, with some calling for another correction and others suggesting that BTC may continue consolidating before any decisive move. The uncertainty highlights the fragile balance between bullish optimism and market caution.
Top analyst Darkfost shared insights that bring back a long-running debate: Does Bitcoin’s traditional cycle structure still hold? While opinions vary, one factor remains consistent across cycles—the influence of long-term holders. Dormant BTC, when moved, often unleashes powerful selling pressure, a dynamic still capable of shaking the market. This cycle has already confirmed that pattern.
As BTC climbed to its all-time high earlier this year, Coin Days Destroyed (CDD)—a key on-chain metric tracking the movement of older coins—spiked noticeably. Historically, such spikes have aligned with tops and significant corrections, showing that long-term holders continue to play a decisive role in shaping market direction.
Value Days Destroyed Signals Potential Relief For BitcoinAccording to Darkfost, the Value Days Destroyed (VDD) metric is offering crucial insights into Bitcoin’s current market structure. Much like Coin Days Destroyed (CDD), VDD tracks the movement of older coins, but it adds another layer by weighting this activity according to price. This adjustment introduces the concept of “value destruction,” giving more weight to long-term holders selling when BTC prices are higher, and less when they are lower. As a result, VDD provides a more nuanced picture of the influence older coins exert on the market.
Recently, VDD reached a level of 2.4, a threshold historically associated with significant selling pressure. In past cycles, spikes to this range have often marked moments when long-term holders locked in profits, contributing to local tops or sharp corrections. The latest spike aligned with Bitcoin’s push to its all-time high, reflecting the familiar pattern of dormant supply resurfacing at peak prices.
However, VDD has since been declining, now approaching levels similar to those seen during prior correction phases. This suggests that the intensity of selling from long-term holders is easing. If this trend continues, the market may find relief from one of its most persistent sources of supply pressure.
Ultimately, easing VDD levels could set the stage for renewed upward momentum, but the key factor will be demand. Without strong inflows and renewed conviction from buyers, the reduction in selling pressure alone may not be enough to spark a sustainable rally. Still, the moderation of long-term holder activity is a promising sign that Bitcoin could stabilize and prepare for another attempt higher in the coming weeks.
Price Action Details: Pushing Above $110KBitcoin is currently trading at $112,286, showing a slight recovery after weeks of selling pressure that pulled the price down from its recent all-time high near $123,217. The chart reveals that BTC is still consolidating within a corrective structure, testing the mid-range between support and resistance levels.
The 50-day moving average (blue line) is trending above the current price, acting as near-term resistance around $115K, while the 100-day moving average (green line) sits close to current levels, providing a short-term pivot point. The 200-day moving average (red line) is much lower at $101K, serving as a deeper structural support if bearish pressure intensifies.
BTC is forming higher lows after its recent dip to the $110K area, signaling that buyers are cautiously stepping back in. However, momentum remains limited, and the chart shows the market has yet to reclaim any major resistance levels. A breakout above $115K would be needed to shift sentiment and open the way toward retesting the $120K–$123K zone.
Featured image from Dall-E, chart from TradingView
Why this matters
This bitcoin story adds another data point to the current market tape and is useful when read alongside nearby source coverage.
Original source
Read on NewsBTCRelated market context

Bitcoin Price Prediction: Bitcoin Tracks Treasury Real Rates, Fidelity Finds
Bitcoin is trading at $82,000, rebounding from $80,000 since yesterday morning, as traders weigh a new macro signal that could fli...

Hot Inflation Data Puts Bitcoin Under Pressure, but ‘Difficult’ Isn’t ‘Bearish’: CoinShares
Bitcoin Magazine Hot Inflation Data Puts Bitcoin Under Pressure, but ‘Difficult’ Isn’t ‘Bearish’: CoinShares Bitcoin’s price has d...

Ethereum Price Prediction: ETH Outpaces the Market as Crypto Rebounds
Ethereum is outperforming the crypto market, rising by almost 3% over the past 24 hours to just a notch under $2,500 as digital as...

XRP Price Prediction: XRP Duo Turn Bullish, $1,000 Dream Lives On
XRP is trading at $1.34, up more than 1% after a brutal Wednesday. Ripple CEO Brad Garlinghouse says XRP has legal clarity despite...
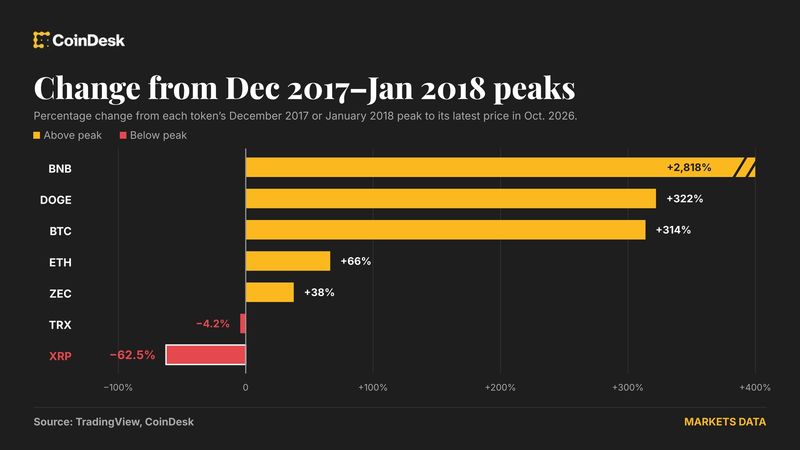
XRP has failed to make holders rich like bitcoin and ether. Here’s why
XRP remains below its 2017-cycle high while bitcoin, ether and other major tokens have surged, enriching their holders.

Claude AI Predicts that Chainlink (LINK) Could Hit Triple Digits in 2026
Claude AI predicts a wildly bullish price target for Chainlink (LINK), claiming it could reach $100 by January 1, 2027, if a near-...