Bitcoin Is Struggling To Hold Its 200-Day MA
Despite the traditional stock market view on 200-day moving averages, a dip below it could mean a sale event for Bitcoin.Bitcoin has been trading at sideways price action for most of December, struggling to stay above th...
Archive context
Older archive item. Useful for background and entity history, but not a fresh market-moving signal.
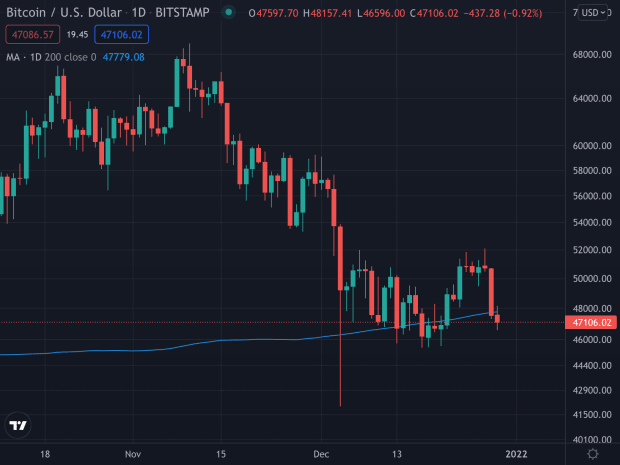
Despite the traditional stock market view on 200-day moving averages, a dip below it could mean a sale event for Bitcoin.
Bitcoin has been trading at sideways price action for most of December, struggling to stay above the 200-day moving average.
After a strong October and an early November of new all-time highs, Bitcoin has encountered a blocking road in December, having lost 13.60% since the beginning of the month. This reality stands in stark contrast to a widespread belief that Bitcoin’s price would hit $100,000 by the end of the year.
At the time of writing, Bitcoin is trading at around $47,500 after having closed below its 200-day moving average on Tuesday. The 200-day MA is often used to gauge an asset’s long-term trend in traditional capital markets. An asset is generally considered to be in an overall uptrend for as long as it holds above its 200-day MA.
Bitcoin closed below its 200-day moving average yesterday. Source: TradingView.In March 2020, Bitcoin violently broke below its 200-day MA as the pandemic outbreak spread fear throughout the world, including capital markets. It took BTC about two months to get back above the moving average, triggering a stellar bull market that would extend past the end of the year. Bitcoin held above its 200-day MA for over a year until China banned bitcoin mining, once again spreading fear to those unaware of Bitcoin’s actual functioning mechanics and triggering a short winter for price over the summer months.
Bitcoin rose from $8,000 to $60,000 in less than one year before correcting below its 200-day MA at around $40,000 in May 2021. Source: TradingView.Despite the traditional stock market view that an asset below its 200-day MA could be in a bear market, for Bitcoin, it could represent a sale event. Given the peer-to-peer (P2P) currency’s strong, unique fundamentals and its history of crushing all other assets over the past 10 years, a dip below a technical indicator can serve as a discount indication, especially given Bitcoin’s volatility, which makes it plunge and soar more rapidly than traditional assets.
Why this matters
This bitcoin story adds another data point to the current market tape and is useful when read alongside nearby source coverage.
Original source
Read on Bitcoin MagazineRelated market context

Blockchain and digital asset news outlet Cointelegraph explores sale: Report
Cointelegraph's traffic collapse highlights the risks of SEO penalties, impacting brand value and posing challenges for potential...

XRP Whales Dominate Exchange Outflows as Bitcoin Shorts Rise on Hyperliquid
The contrasting flows highlight a market where some large investors are moving XRP away from exchanges even as leveraged traders p...

OKX Eyes 63 U.S. Stocks in Major Tokenized Trading Expansion
Key Takeaways: OKXICE informed the SEC about its plan to establish an online platform called “Tokenized Securities Venue” that wou...

XRP Price Eyes New Catalyst as Ripple Partners With South Korea’s Meritz
Ripple and South Korean brokerage Meritz Securities have signed a strategic partnership to assess Ripple Custody and Ripple’s toke...

Bitcoin Falls Under $83,000 on Oil Spike, Rising US Borrowing Costs
Bitcoin Magazine Bitcoin Falls Under $83,000 on Oil Spike, Rising US Borrowing Costs Bitcoin’s price has plunged — with other asse...

Bitcoin’s failed breakout reveals a dangerous mix of thin volume and easy profits
Bitcoin has fallen nearly 5% this week as weak trading volume and profit-taking blunt attempts to reclaim $85,000. The largest cry...