Bitcoin Price Could Explode By 379% If This Indicator Is Correct
A well-known crypto analyst, who goes by the name TechDev, has recently revealed that Bitcoin (BTC) may experience a significant surge if a particular key indicator continues to follow historical data. TechDev is closely...
Archive context
Older archive item. Useful for background and entity history, but not a fresh market-moving signal.
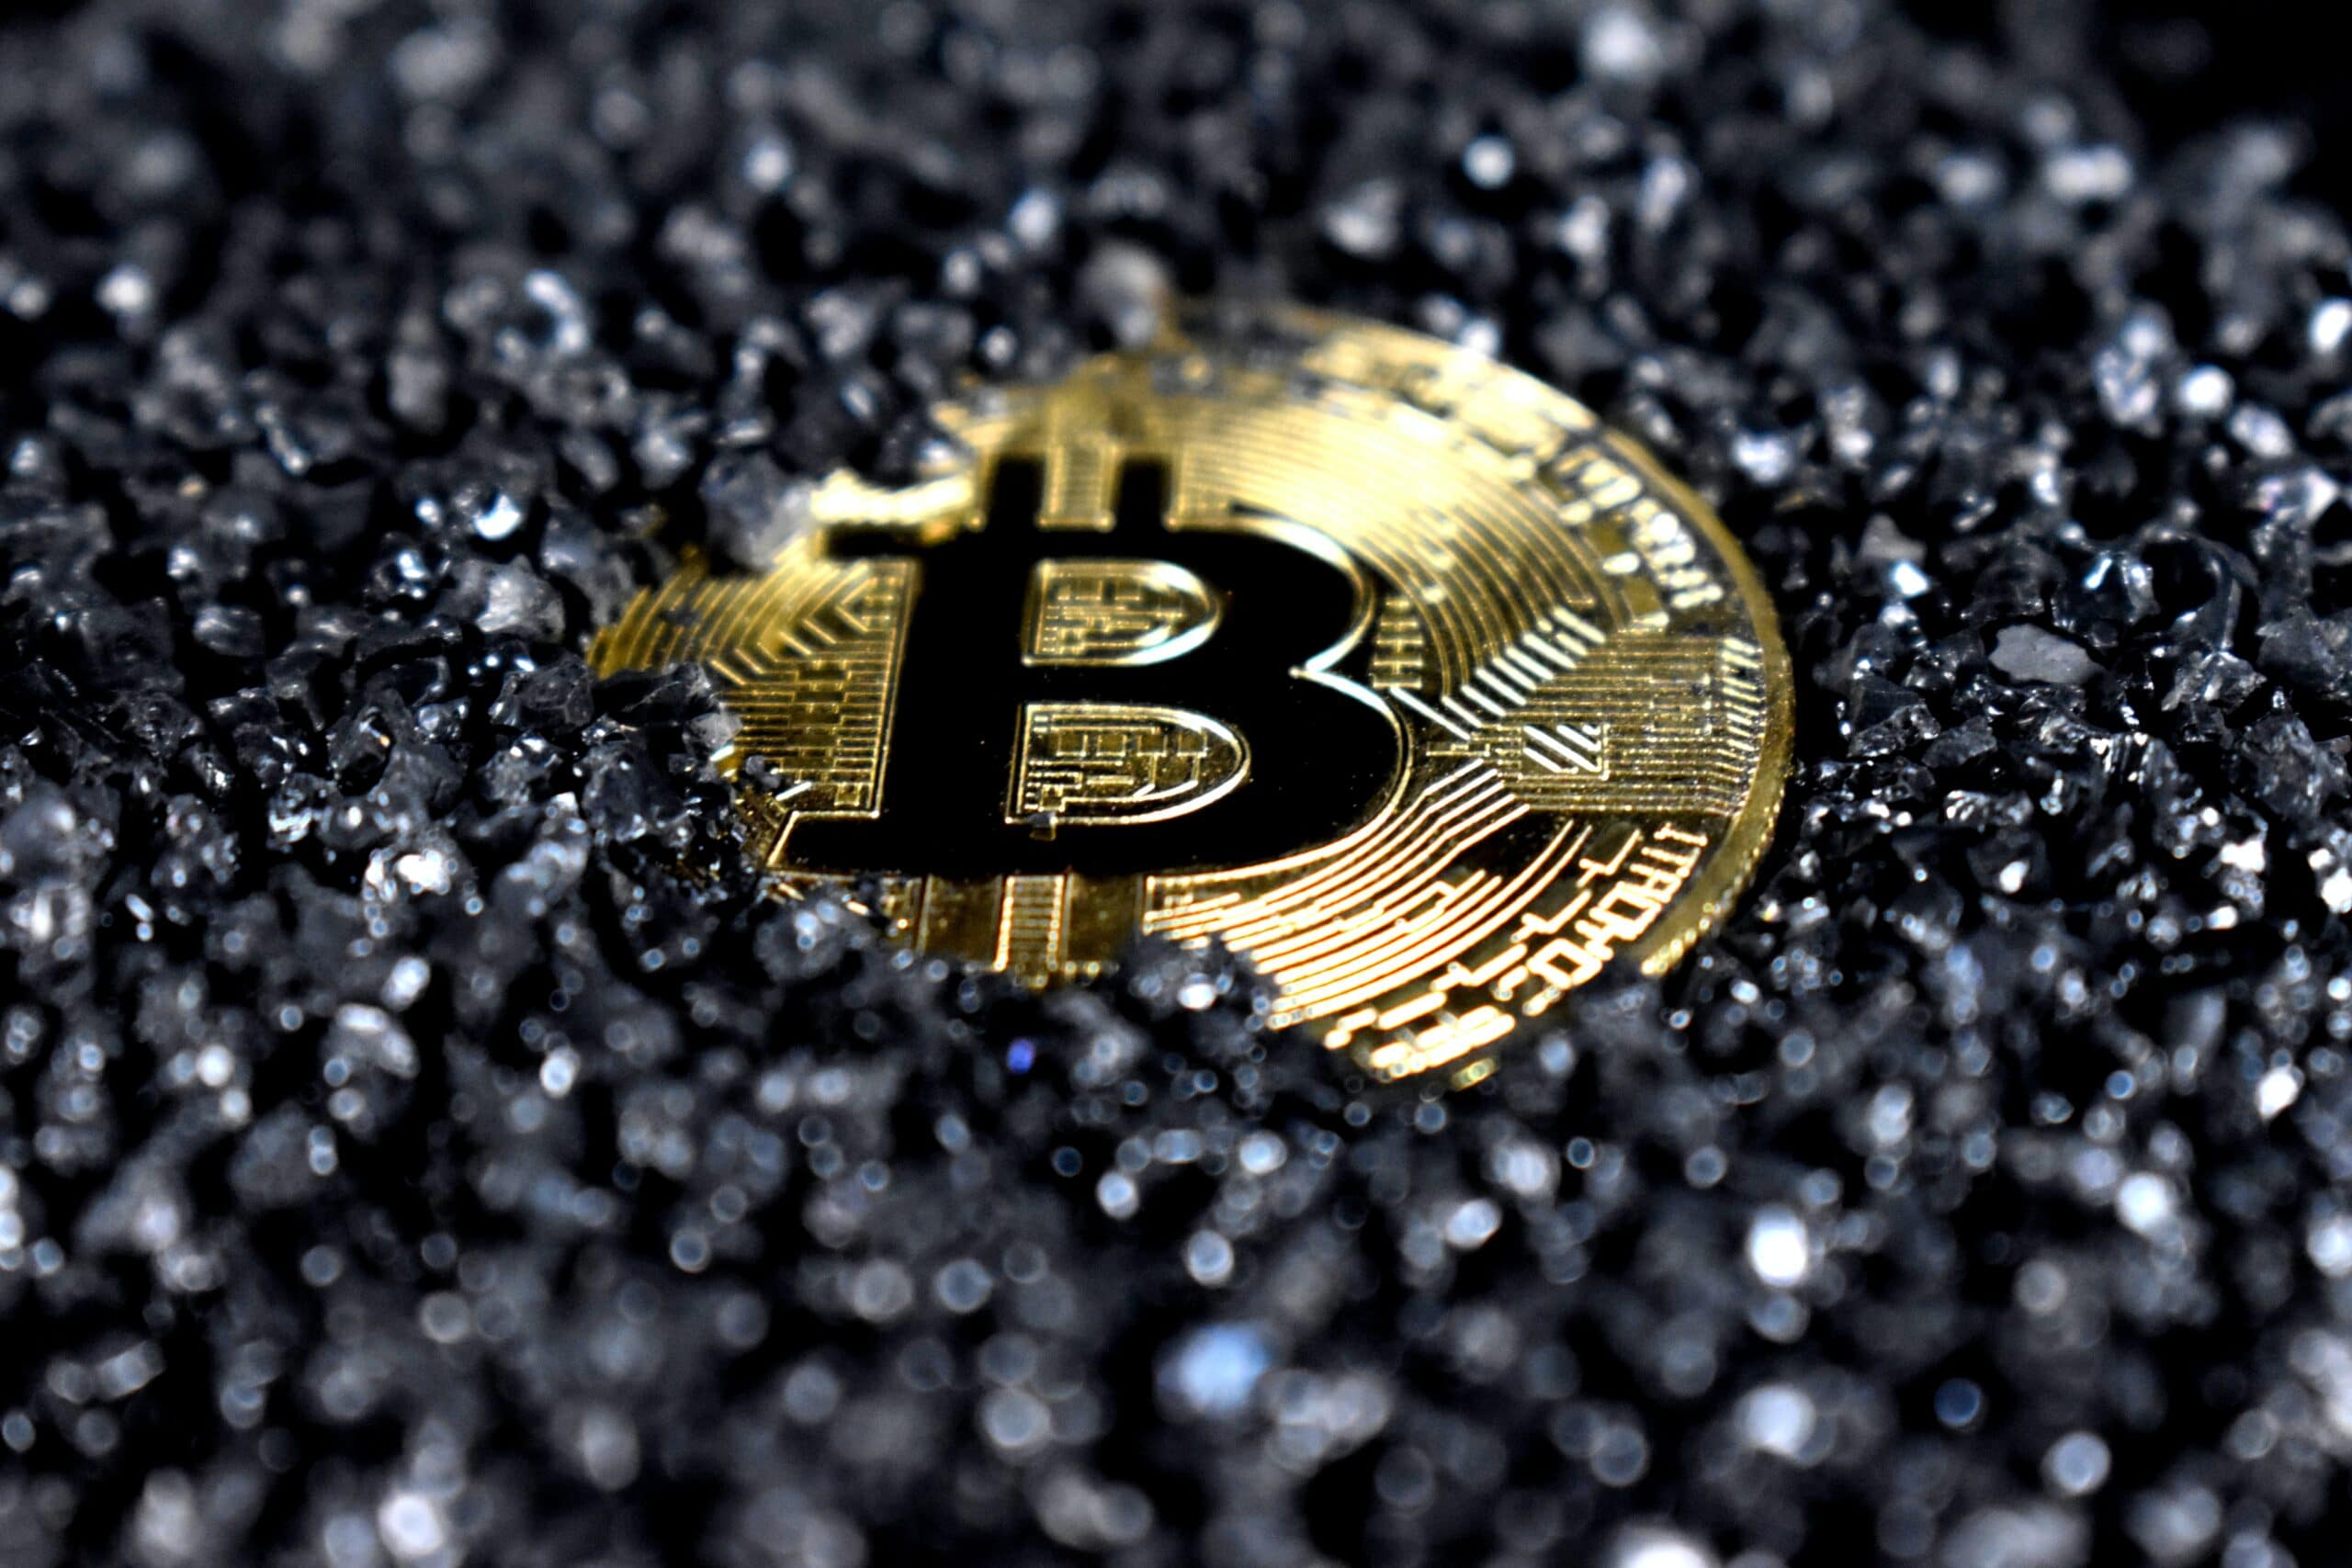
A well-known crypto analyst, who goes by the name TechDev, has recently revealed that Bitcoin (BTC) may experience a significant surge if a particular key indicator continues to follow historical data.
TechDev is closely monitoring global liquidity cycles. To illustrate this, TechDev is comparing the Chinese 10-year bonds (CN10Y) against the US dollar index (DXY).
Monitoring liquidity cyclesThe analyst also provides further information on global liquidity cycles by comparing the metric against the aggregate major central bank balance sheet, which tracks the money-printing activities of reserve banks worldwide.
According to a chart shared by TechDev, global liquidity seems to be on the verge of an uptrend, as major central banks are expanding their balance sheets.
The chart also reveals that Bitcoin appears to closely follow global liquidity, indicating that BTC may experience rapid price acceleration in the coming months.
Based on its current trajectory, Bitcoin could potentially reach TechDev’s logarithmic growth curve (LGC) by 2025 or earlier. LGCs are used to predict the long-term highs and lows of Bitcoin, while disregarding short-term volatility.
TechDev estimates that the upper limit of the LGC is likely to fall between $100,000 and $140,000, but this is only a rough approximation based on specific curve parameters and impulse steepness.
Given that BTC is currently trading at $29,186, reaching $140,000 would result in an almost 380% price increase.
The leading cryptocurrency by market cap has experienced a 0.68% decrease in the last 24 hours, but has seen a small increase of nearly 0.5% in the past week.
However, Bitcoin is still down by almost 58% from its record high of over $69,000, which was recorded in November 2021.
Additionally, TechDev has observed that the altcoin market cap chart for the past three weeks is currently at its highest level of compression ever seen, and Bitcoin’s Bollinger bands width (BBW) is hovering just above 0.50 – a relatively low level.
Why this matters
This bitcoin story adds another data point to the current market tape and is useful when read alongside nearby source coverage.
Original source
Read on CryptoGazetteRelated market context

OKX Eyes 63 U.S. Stocks in Major Tokenized Trading Expansion
Key Takeaways: OKXICE informed the SEC about its plan to establish an online platform called “Tokenized Securities Venue” that wou...

Why Bitcoin’s Liquidity Advantage Matters as Institutions Move In
Bitcoin Magazine Why Bitcoin’s Liquidity Advantage Matters as Institutions Move In Bitcoin’s portability, divisibility and accessi...
Wells Fargo in talks with Kraken parent Payward for crypto trading liquidity
The discussions would see Payward supply liquidity for crypto trading as major banks deepen their involvement in digital assets.

Bitcoin pulls back as analysts forecast $80,000-$90,000 Q4 trading range
Bitcoin traded near $82,000 on Thursday, with analysts at QCP expecting a fourth-quarter range of $80,000 to $90,000.

Wells Fargo Reportedly Talking With Kraken Parent Payward to Source Crypto Trading Liquidity
Wells Fargo is in discussions with Payward, the company that operates the Kraken exchange, about a deal that would have Payward su...

Ethereum Price Prediction: 5% Weekly Drops as Bitmine Plans to Stop ETH Buying
Ethereum latest selloff has put a key support zone and price prediction under pressure. ETH falls to $2,500 after 5% weekly declin...