Bitcoin Price Eyes Additional Upsides: Will The Recovery Persist?
Bitcoin price is consolidating near the $57,500 zone. BTC could gain bullish momentum if it clears the $58,000 resistance zone in the near term. Bitcoin started a recovery wave above the $55,500 and $56,500 levels. The p...
Archive context
Older archive item. Useful for background and entity history, but not a fresh market-moving signal.

Bitcoin price is consolidating near the $57,500 zone. BTC could gain bullish momentum if it clears the $58,000 resistance zone in the near term.
- Bitcoin started a recovery wave above the $55,500 and $56,500 levels.
- The price is trading above $57,000 and the 100 hourly Simple moving average.
- There was a break above a key bearish trend line with resistance at $56,850 on the hourly chart of the BTC/USD pair (data feed from Kraken).
- The pair might struggle to clear the $58,250 resistance zone.
Bitcoin price started a recovery wave above the $53,500 resistance zone. BTC was able to clear the $55,500 and $56,500 resistance levels to move into a short-term positive zone.
There was a move above the 61.8% Fib retracement level of the key drop from the $61,040 swing high to the $49,110 swing low. Besides, there was a break above a key bearish trend line with resistance at $56,850 on the hourly chart of the BTC/USD pair.
The bulls are now attempting more upsides above $57,500. Bitcoin price is now trading above $57,000 and the 100 hourly Simple moving average. On the upside, the price could face resistance near the $58,250 level. It is close to the 76.4% Fib retracement level of the key drop from the $61,040 swing high to the $49,110 swing low.
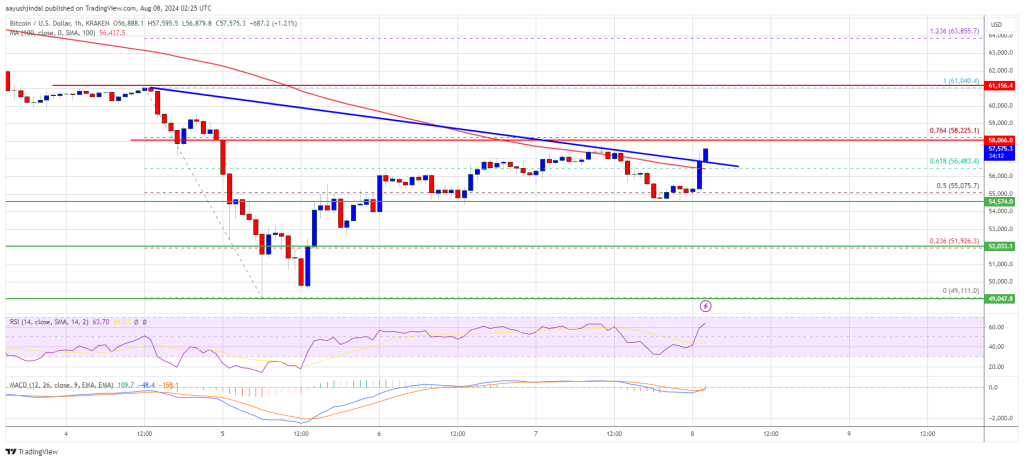
The first key resistance is near the $58,800 level. A clear move above the $58,800 resistance might send the price further higher in the coming sessions. The next key resistance could be $59,500. The next major hurdle sits at $60,000. A close above the $60,000 resistance might spark bullish moves. In the stated case, the price could rise and test the $62,000 resistance.
Another Decline In BTC?If Bitcoin fails to recover above the $58,250 resistance zone, it could start another decline. Immediate support on the downside is near the $56,400 level and the 100 hourly SMA.
The first major support is $54,500. The next support is now near $53,500. Any more losses might send the price toward the $52,000 support zone in the near term.
Technical indicators:
Hourly MACD – The MACD is now gaining pace in the bullish zone.
Hourly RSI (Relative Strength Index) – The RSI for BTC/USD is now above the 50 level.
Major Support Levels – $56,400, followed by $54,500.
Major Resistance Levels – $58,250, and $58,800.
Why this matters
This bitcoin story adds another data point to the current market tape and is useful when read alongside nearby source coverage.
Original source
Read on NewsBTCRelated market context

Bitcoin (BTC) Price Prediction: $74K Liquidity Gap Puts $80K Support to the Test
Meanwhile, data from Glassnode and Fasanara Digital show that traditional financial assets are capturing a growing share of deriva...

Anthropic’s Claude AI Predicts a Huge Move for Solana by 2027
Something potentially significant could happen for Solana by January 1, 2027, as Anthropic’s Claude AI predicts that SOL could be...

Bitcoin Price Hovers Near $80,000 as Traders Await Fed Decision
Bitcoin Magazine Bitcoin Price Hovers Near $80,000 as Traders Await Fed Decision Bitcoin price traded near $80,000 on Monday, afte...

How Solana Supports Fast Crypto Payments in Digital Gaming
Picture a SOL holder on a quiet evening, watching the token tick sideways on a chart that hasn’t done much all week. Rather than r...

Robinhood Chain Nears $30B DEX Volume While $1.1B DeFi Base Fuels Fresh Tease
Key Takeaways: As reported by DefiLlama, Robinhood Chain has now surpassed $30 billion in 30-day decentralized exchange volume. DE...

Bitcoin Price Rebounds Again, Peter Schiff Repeats His Crash Warnings
Bitcoin price has once again challenged Peter Schiff’s latest crash warning, after the longtime crypto critic predicted BTC would...