Bitcoin Price Faces Uncertainty: Is The Risk of a Drop Growing?
Bitcoin price is consolidating losses below the $95,500 zone. BTC is showing bearish signs and might struggle to recover above the $95,800 level. Bitcoin started a recovery wave from the $91,150 zone. The price is tradin...
Archive context
Older archive item. Useful for background and entity history, but not a fresh market-moving signal.

Bitcoin price is consolidating losses below the $95,500 zone. BTC is showing bearish signs and might struggle to recover above the $95,800 level.
- Bitcoin started a recovery wave from the $91,150 zone.
- The price is trading below $94,500 and the 100 hourly Simple moving average.
- There was a break above a connecting bearish trend line with resistance at $93,650 on the hourly chart of the BTC/USD pair (data feed from Kraken).
- The pair could start another increase if it stays above the $92,500 support zone.
Bitcoin price started a short-term recovery wave above the $92,000 resistance. BTC was able to climb above the $93,500 and $94,000 levels.
The bulls were able to push the price above the 23.6% Fib retracement level of the downward move from the $102,761 swing high to the $91,168 low. Besides, there was a break above a connecting bearish trend line with resistance at $93,650 on the hourly chart of the BTC/USD pair.
However, the bears are still active below the $95,800 level. Bitcoin price is now trading below $95,000 and the 100 hourly Simple moving average. On the upside, immediate resistance is near the $95,000 level.
The first key resistance is near the $95,800 level. A clear move above the $95,800 resistance might send the price higher. The next key resistance could be $97,000 or the 50% Fib retracement level of the downward move from the $102,761 swing high to the $91,168 low.

A close above the $97,000 resistance might send the price further higher. In the stated case, the price could rise and test the $98,800 resistance level. Any more gains might send the price toward the $99,500 level.
Another Drop In BTC?If Bitcoin fails to rise above the $95,800 resistance zone, it could start a fresh decline. Immediate support on the downside is near the $92,500 level.
The first major support is near the $92,000 level. The next support is now near the $91,200 zone. Any more losses might send the price toward the $90,000 support in the near term.
Technical indicators:
Hourly MACD – The MACD is now gaining pace in the bearish zone.
Hourly RSI (Relative Strength Index) – The RSI for BTC/USD is now below the 50 level.
Major Support Levels – $92,500, followed by $91,200.
Major Resistance Levels – $95,000 and $95,800.
Why this matters
This bitcoin story adds another data point to the current market tape and is useful when read alongside nearby source coverage.
Original source
Read on NewsBTCRelated market context

Mark Zuckerberg Meta AI Predicts an Insane Run for BTC in Q4
Something potentially seismic could be approaching for Bitcoin by January 1, 2027. Mark Zuckerberg’s Meta AI predicts that if a fu...

Bitcoin Faces $85,000–$87,500 Supply Test After $80,000 Rebound
TL;DR: Glassnode’s October 21 report identifies an overhead Bitcoin supply zone around $85,000–$87,500 after bids returned near $8...

Ethereum Glamsterdam Upgrade Delayed Over Smart Contract Security Risks
Ethereum developers have postponed the Glamsterdam upgrade on the Hoodi testnet after researchers identified potential security ri...
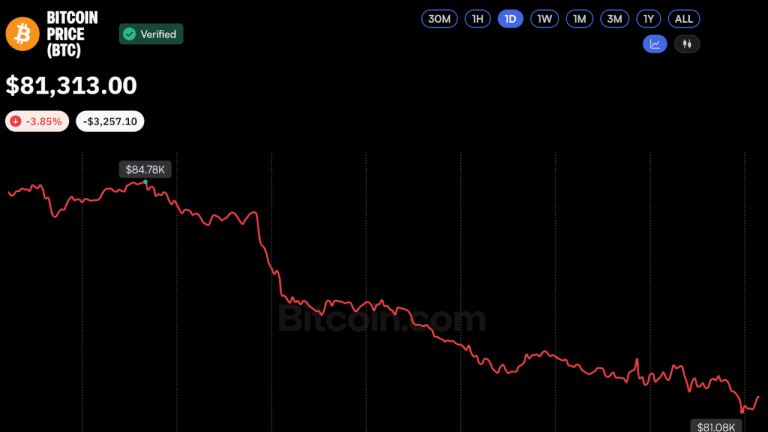
Bitcoin Price Plunges Below $81K Despite $1 Billion in ETF Inflows
Bitcoin dropped below $82,000 to an intraday low of $80,836 during a late Wednesday sell-off, capping a nearly 4% daily loss and h...

Bitcoin Slides Towards $81,000 as Oil Above $110 Revives Rate-Hike Bets
Bitcoin Magazine Bitcoin Slides Towards $81,000 as Oil Above $110 Revives Rate-Hike Bets Bitcoin’s price on Thursday slid — erasin...

XRP Ledger bug fix delayed to November after validator support dip
The delay in the XRP Ledger bug fix may heighten market uncertainty, affecting confidence and price momentum for XRP in the near t...