Bitcoin Price Reaches $21,000, Shorts Demolished In Biggest Squeeze Since 2021
Bulls take charge with massive upward momentum. Key price levels to watch to determine whether this is another bear market rally or a move with lasting power.The below is an excerpt from a recent edition of Bitcoin Magaz...
Archive context
Older archive item. Useful for background and entity history, but not a fresh market-moving signal.

Bulls take charge with massive upward momentum. Key price levels to watch to determine whether this is another bear market rally or a move with lasting power.
The below is an excerpt from a recent edition of Bitcoin Magazine PRO, Bitcoin Magazine's premium markets newsletter. To be among the first to receive these insights and other on-chain bitcoin market analysis straight to your inbox, subscribe now.
Net Liquidity And Moving AveragesOne of the most useful models in tracking the cyclical tops for both the S&P 500 Index and bitcoin since March 2020 has proven to be net liquidity, an original model by 42 Macro. Net liquidity tracks the changes in Federal Reserve total assets, the U.S. Treasury general account balance and the reverse repo facility. A lower net liquidity translates to less capital available to deploy in markets. We find it useful as a key macro indicator to assess current liquidity conditions and how bitcoin trades in the market.
Bitcoin has acted as a liquidity sponge throughout its life and contracting liquidity in all markets has had a significant impact on the bitcoin price and trajectory. Ultimately, that’s one of the main drivers of our core long-term thesis that bitcoin’s growth depends on an environment of perpetual monetary debasement and expanding liquidity to work against current levels of unsustainable sovereign debt and deflationary forces. In the short-term, it’s not clear when overall liquidity will increase again en masse. That’s the trillion dollar question and the topic of conversation on which everyone is speculating. Net liquidity provides a view into that trajectory as a measure that’s updated weekly with fresh data.
Bitcoin is seeing some of its largest relative strength since January 2021, but it also comes at a time when we’re seeing a significant daily uptick in net liquidity after a period of historically low volatility. The uptick is driven by a much lower reverse repo balance since the start of the year. With the Fed’s position of “higher for longer,” a projected view of Core CPI at 3.5% for 2023 and continued balance sheet runoff, we will likely see net liquidity decline — barring a spontaneous or emergency policy reversal.
Price has broken above the short-term holder realized price. That’s happened only a few times in this bear market and these events were short-lived. As this price reflects the average on-chain cost basis of the more recent buyers, it will be key to see if these market participants are looking to sell here at cost or if they will stay to continue with the momentum.
The 200-day moving average may seem somewhat arbitrary, but the mere fact that many technical traders and momentum- and trend-based investors monitor this level gives it significance. A clean break above could mean continued strength for bitcoin in the coming days and weeks ahead.
The price action to start the new year has been quite the promising sign for bitcoin bulls. Similarly, over the last week, shorts as a percentage of futures liquidations has reached its highest level in the history of the data. While shorts have been decimated as of late, it’s likely that this immediate upside could be capped.
While there is a long way to go in terms of surpassing previous bull market heights, the year-to-date performance has been hopeful following a year where the industry practically imploded.
Overall, this is a promising start to 2023.
Like this content? Subscribe now to receive PRO articles directly in your inbox.
Relevant Articles:Why this matters
This bitcoin story adds another data point to the current market tape and is useful when read alongside nearby source coverage.
Original source
Read on Bitcoin MagazineRelated market context

One year after 10/10, Bitcoin and Ether liquidity is back while altcoins lag
The crypto market's bifurcation highlights Bitcoin and Ether's institutional appeal, while altcoins face volatility and limited gr...

What Is Crypto Spot Trading?
For example, a token can be up 70% and still be a terrible trade if you have no idea when to take profits. Likewise, a 30% dip can...

Stealing $1.5B in crypto is easy, cashing out is the trap
North Korean hackers stole around $1.5 billion from Bybit in February 2025. While the hack itself has been widely covered and anal...
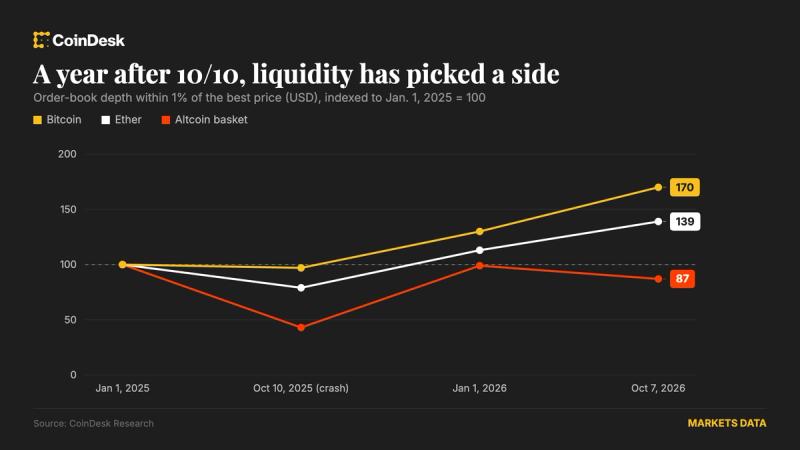
One year after 10/10, bitcoin and ether liquidity have rebuilt, but other altcoins still face risks
Bitcoin and ether order books are deeper than before the crash, while altcoin liquidity keeps eroding and spot trading remains wel...
Here’s How Not To Screw up Your Bitcoin Privacy
Bitcoin Magazine Here’s How Not To Screw up Your Bitcoin Privacy Just one transaction can compromise years of discreet Bitcoin act...

Locked liquidity did not stop this $14 million crypto pool drain
The PancakeSwap pool for 79AU, 79thVault’s token, lost $14.35 million in USDT on Oct. 7 through two selling wallets, according to...