Bitcoin Price Restarts Rally, Why BTC Could Soon Hit $65K
Bitcoin price is gaining momentum above the $62,000 resistance. BTC is signaling an upside break and might surge toward the $65,000 resistance. Bitcoin price is moving higher from the $61,200 support zone. The price is t...
Archive context
Older archive item. Useful for background and entity history, but not a fresh market-moving signal.

Bitcoin price is gaining momentum above the $62,000 resistance. BTC is signaling an upside break and might surge toward the $65,000 resistance.
- Bitcoin price is moving higher from the $61,200 support zone.
- The price is trading above $62,500 and the 100 hourly Simple moving average.
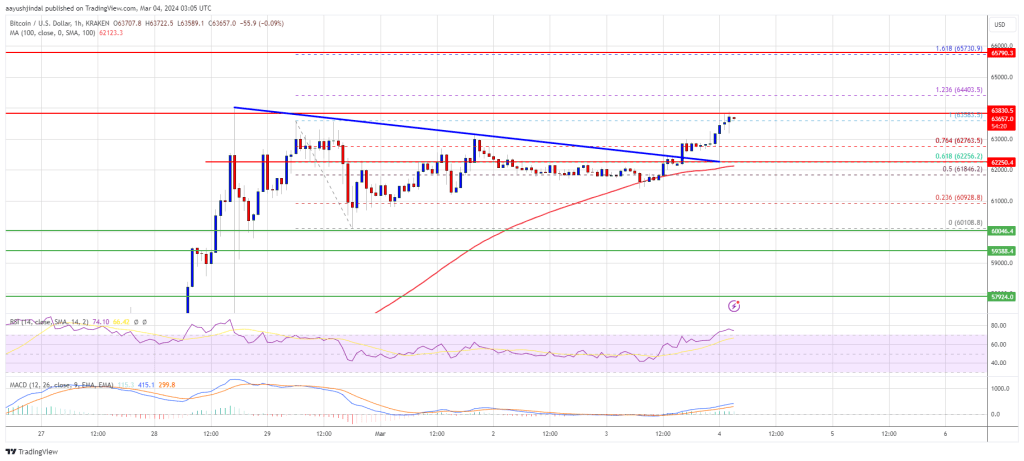
- There was a break above a key bearish trend line with resistance at $62,300 on the hourly chart of the BTC/USD pair (data feed from Kraken).
- The pair could accelerate higher toward the $65,000 resistance or even $65,730.
Bitcoin price remained well-bid above the $60,000 support zone. A base was formed, and the price started a fresh increase above the $62,000 resistance.
There was a break above a key bearish trend line with resistance at $62,300 on the hourly chart of the BTC/USD pair. The pair even cleared the 76.4% Fib retracement level of the downward move from the $63,583 swing high to the $60,108 low.
Bitcoin is now trading above $62,500 and the 100 hourly Simple moving average. Immediate resistance is near the $63,800 level. The next key resistance could be $64,500, above which the price could rise toward the $65,000 resistance zone.
Source: BTCUSD on TradingView.com
If the bulls remain in action, the price could even surpass $65,000 and test $65,500. Any more gains might send the price toward the 1.618 Fib extension level of the downward move from the $63,583 swing high to the $60,108 low at $65,730.
Are Dips Supported In BTC?If Bitcoin fails to rise above the $64,000 resistance zone, it could start another downside correction. Immediate support on the downside is near the $62,750 level.
The first major support is $62,250 or the 100 hourly SMA. If there is a close below $62,250, the price could start a decent pullback toward the $61,000 zone. Any more losses might send the price toward the $60,000 support zone.
Technical indicators:
Hourly MACD – The MACD is now gaining pace in the bullish zone.
Hourly RSI (Relative Strength Index) – The RSI for BTC/USD is now above the 50 level.
Major Support Levels – $62,750, followed by $62,250.
Major Resistance Levels – $63,800, $65,000, and $65,730.
Why this matters
This bitcoin story adds another data point to the current market tape and is useful when read alongside nearby source coverage.
Original source
Read on NewsBTCRelated market context

Copilot AI Predicts PI Network Binance Price
Something potentially explosive could be building for Pi Network (PI) by January 1, 2027. Microsoft Copilot AI predicts that a spe...

Mark Zuckerberg’s Meta AI Predicts a Near Protocol Explosion
Something potentially transformative could hit NEAR Protocol by January 1, 2027. Mark Zuckerberg’s Meta AI predicts that in an int...
Ethereum Client Updates Address Certificate Risk in Teku and Besu
TL;DR: Ethereum software teams have published updates addressing trust-store exposure tied to compromised certificate-authority ke...
Robinhood Crypto Revenue Falls 55% as Prediction Markets Support Growth
TL;DR: Robinhood reported third-quarter 2026 results on October 27, with total net revenue of about $1.42 billion, up 12% from the...

Bitcoin Price Faces $11B Options Expiry After FOMC Uncertainty Clears
Bitcoin price faces another major test on October 30, when $11 billion in options contracts expire. The FOMC has already delivered...

Kraken USDC Jumps 30% While EURC Trading Nears 1B in Circle Stablecoin Expansion
Key Takeaways: USDC on Kraken trading volume increased over 30% in a 1-year time period. Kraken has traded nearly 1 billion EURC s...